Christina Lake Cannabis Corp. (the “Company” or “CLC” or
“Christina Lake Cannabis”) (CSE: CLC) (OTCQB: CLCFF)
(FRANKFURT: CLB) is pleased to report its financial
results for the third quarter ended August 31, 2023 (“Q3’23”). All
amounts are expressed in Canadian dollars unless otherwise noted.
Q3’23 Highlights
- Revenue up 30% to $8.9M over
nine-month period end Q3’22;
- Distillate volumes sold increased
by 85% compared to the nine-month period ending Q3’22;
- Gross profit of $4.0M or 45.2%
before fair value adjustments for the nine-month period;
- Decreased G&A expenses by $137k
or 4% from prior year period
“Through a steadfast commitment to meeting our
customers’ ever-expanding demands and consistently delivering high
quality products, CLC has continued to maintain impressive sales
growth in Q3,” said Mark Aiken, Chief Executive Officer of
Christina Lake Cannabis. “Our agility in responding to
dynamic market conditions is evident through the successful
introduction of our expanded product lines, garnering positive
customer feedback and substantial reorders. Our continued success
is a testament to our relentless pursuit of excellence, our
continuous drive for operating efficiency, and our focus on
innovation.”
OPERATIONAL AND FINANCIAL
HIGHLIGHTS
|
|
August 31,2023 |
August 31,2022 |
$ Change |
% Change |
|
Revenue from the sale of goods |
$ |
8,939,679 |
|
$ |
6,885,968 |
|
$ |
2,053,711 |
|
30 |
% |
|
Costs of sales |
|
(4,895,324 |
) |
|
(3,284,724 |
) |
|
1,610,600 |
|
49 |
% |
|
Gross profit before fair value adjustment |
|
4,044,355 |
|
|
3,601,244 |
|
|
443,111 |
|
12 |
% |
|
Changes in fair value of inventory sold |
|
(2,305,915 |
) |
|
(1,173,677 |
) |
|
1,132,238 |
|
96 |
% |
|
Gross profit from sale of goods |
|
1,738,440 |
|
|
2,427,567 |
|
|
(689,127 |
) |
(28 |
%) |
|
Fair value change growth biological asset |
|
2,614,303 |
|
|
3,002,383 |
|
|
(388,080 |
) |
(13 |
%) |
|
General and administrative expenses |
|
(3,134,742 |
) |
|
(3,271,790 |
) |
|
(137,048 |
) |
(4 |
%) |
|
Other items |
|
(722,949 |
) |
|
1,556 |
|
|
(724,505 |
) |
(46562 |
%) |
|
Income (loss) |
|
495,052 |
|
|
2,159,716 |
|
|
(1,664,664 |
) |
(77 |
%) |
|
|
|
|
|
|
|
Income (loss) per share |
|
0.00 |
|
|
0.02 |
|
|
|
|
|
|
|
|
|
|
Gross margin % |
|
45.2 |
% |
|
52.3 |
% |
|
|
|
|
|
|
|
|
|
Financial Position |
|
|
|
|
|
Working capital |
|
4,139,795 |
|
|
3,683,558 |
|
|
|
|
Inventory |
|
1,954,344 |
|
|
4,621,213 |
|
|
|
|
Biological assets |
|
4,035,020 |
|
|
4,380,074 |
|
|
|
|
Total assets |
|
18,836,093 |
|
|
21,483,084 |
|
|
|
|
Total liabilities |
|
7,121,404 |
|
|
6,725,056 |
|
|
|
|
|
|
|
|
|
|
|
|
|
Distillate volumes sold increased by 85% from
the comparative period ending Q3’22 resulting in revenue growth of
30% to $8.9M from $6.9M despite market price compression in the
price of distillate. Revenue growth was primarily driven by
increased demand in distillate.
Gross Margin Before Fair Value Adjustments was
45.2% compared to 52.3% in the prior year period. The decline in
gross margin is primarily attributed to a significant drop in the
price of wholesale distillate. Cost of goods sold increased by 49%
from the comparative period due to the significant increase in
distillate volume produced and sold as noted above. The Company
continues to work towards production efficiencies to combat price
compression in the wholesale distillate market as production and
sales continued to ramp up.
Total general & administrative (“G&A”)
expenses declined by $137k or 4% from prior comparative period,
driven by year-over-year reductions in consulting fees, management
fees, insurance, marketing, share based compensation and repairs
and maintenance expenses, which were partially offset by increases
in depreciation, professional fees, research and development,
salaries and regulatory fees. G&A decreased to 35% of revenue
during the period, compared with 48% in the prior year.
Income (Loss) and comprehensive income (loss) in
Q3’23 was $495k which is a $1.7M decrease from the prior year
period income of $2.2M. The year-over-year decrease in income is
primarily driven by an increase in changes in fair value of
inventory sold of $1.1M, a reduction in income from other items
relating to a one-time settlement of $258k and debt modification of
$386k in the comparative period, and a decrease in the fair value
change in biological asset adjustment of $388k.
Cash and Working Capital
As at August 31, 2023, the Company had working
capital of $4,139,795 (November 30, 2022 – $3,683,558) which
consisted of cash of $1,728,432 (November 30, 2022 - $1,810,639),
receivables of $2,312,232 (November 30, 2022 - $1,906,820), prepaid
expenses of $51,757 (November 30, 2022 - $3,885), inventory of
$1,954,344 (November 30, 2022 - $5,766,418), Biological assets of
$4,035,020 (November 30, 2022 - $Nil). Current liabilities, being
accounts payable and accrued liabilities, current portion of loan
and current portion of convertible debentures, $5,941,991 (November
30, 2022 – $5,832,954).
About Christina Lake Cannabis
Corp.
Christina Lake Cannabis is a licensed producer
of cannabis under the Cannabis Act. It has secured a standard
cultivation license and corresponding processing amendment from
Health Canada (March 2020 and August 2020, respectively) as well as
a research and development license (early 2020). Christina Lake
Cannabis’ facility consists of a 32-acre property, which includes
over 950,000 square feet of outdoor grow space, offices,
propagation and drying rooms, research facilities, and a facility
dedicated to processing and extraction. Christina Lake Cannabis
also owns a 99-acre plot of land adjoining its principal
site. CLC focuses its production on creating high quality
extracts and distillate for its B2B client base with proprietary
strains specifically developed for outdoor cultivation to enhance
extraction quality.
On behalf of Christina Lake
Cannabis:
“Mark Aiken”Mark Aiken, CEO
For more information about CLC, please
visit: www.christinalakecannabis.com
Jennifer SmithInvestor Relations and Media
Inquiriesinvestors@clcannabis.com902-229-7265
THE CANADIAN SECURITIES EXCHANGE (“CSE”) HAS NOT
REVIEWED AND DOES NOT ACCEPT RESPONSIBILITY FOR THE ACCURACY OR
ADEQUACY OF THIS RELEASE, NOR HAS OR DOES THE CSE’S REGULATION
SERVICES PROVIDER.
Non-IFRS Financial Measures
In this news release, the Company reports "Gross
Margin Before Fair Value Adjustments", a financial measure that is
not determined or defined in accordance with the International
Financial Reporting Standards, as issued by the International
Accounting Standards Board ("IFRS"). Gross Margin
Before Fair Value Adjustments does not have a standardized meaning
prescribed by IFRS and the Company's methods of calculating this
financial measure may differ from methods used by other companies.
Accordingly, such non-IFRS financial measure may not be comparable
to similarly titled measures presented by other companies. This
measure is provided as additional information to complement IFRS by
providing a further understanding of operations from management's
perspective and should not be considered in isolation or as a
substitute for measures of performance prepared in accordance with
IFRS. Gross margin before fair value adjustments are non-GAAP
financial measures that is calculated as revenue less cost of goods
sold, excluding changes in fair value of biological assets and
change in fair value of biological assets through inventory
sold.
This data is furnished to provide additional
information and are non-IFRS measures and do not have any
standardized meaning prescribed by IFRS. The Company uses these
non-IFRS measures to provide shareholders and others with
supplemental measures of its operating performance. The Company
also believes that securities analysts, investors and other
interested parties, frequently use these non-IFRS measures in the
evaluation of companies, many of which present similar metrics when
reporting their results. As other companies may calculate these
non-IFRS measures differently than the Company, these metrics may
not be comparable to similarly titled measures reported by other
companies.
Forward Looking Statements
This news release contains statements that
constitute "forward-looking statements." Such forward-looking
statements involve known and unknown risks, uncertainties and other
factors that may cause actual results, performance or achievements,
or developments in the industry to differ materially from the
anticipated results, performance or achievements expressed or
implied by such forward-looking statements. Forward-looking
statements are statements that are not historical facts and are
generally, but not always, identified by the words "expects",
"plans", "anticipates", "believes", "intends", "estimates",
"projects", "potential" and similar expressions, or that events or
conditions "will", "would", "may", "could" or "should" occur.
Although the Company believes that the expectations and assumptions
on which the forward-looking statements are based are reasonable,
undue reliance should not be placed on the forward-looking
statements because the Company can give no assurance that they will
prove to be correct. Since forward-looking statements address
future events and conditions, by their very nature they involve
inherent risks and uncertainties. These statements speak only as of
the date of this News Release. Actual results could differ
materially from those currently anticipated due to a number of
factors and risks including various risk factors discussed in the
Company’s disclosure documents which can be found under the
Company’s profile on http://www.sedarplus.com. Should one or
more of these risks or uncertainties materialize, or should
assumptions underlying the forward-looking statements prove
incorrect, actual results may vary materially from those described
herein as intended, planned, anticipated, believed, estimated or
expected. The Company does not intend, and does not assume any
obligation, to update these forward-looking statements except as
otherwise required by applicable law.
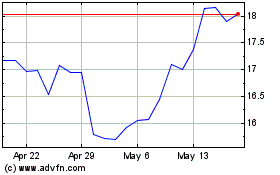
Core Laboratories (NYSE:CLB)
Historical Stock Chart
From Dec 2024 to Jan 2025

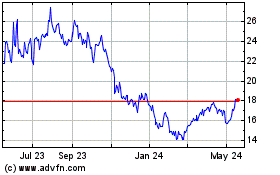
Core Laboratories (NYSE:CLB)
Historical Stock Chart
From Jan 2024 to Jan 2025
