Bri-Chem Announces 2019 Second Quarter Financial Results
August 07 2019 - 9:39PM

Bri-Chem Corp. (“Bri-Chem” or “Company”) (TSX:
BRY), a leading North American oilfield chemical
distribution and blending company, is pleased to announce its 2019
second quarter financial results.
|
|
|
Three months ended |
|
|
|
|
Six months ended |
|
|
|
|
|
|
|
|
June 30 |
|
Change |
|
|
June 30 |
|
Change |
|
|
(in '000s except per share amounts) |
|
2019 |
|
|
2018 |
|
|
$ |
|
% |
|
|
2019 |
|
|
2018 |
|
|
$ |
|
% |
|
|
|
Sales |
$ |
22,721 |
|
$ |
27,255 |
|
$ |
(4,534 |
) |
(17 |
%) |
$ |
48,619 |
|
$ |
62,572 |
|
$ |
(13,953 |
) |
(22 |
%) |
|
|
Adjusted EBITDA(1) |
|
447 |
|
|
(366 |
) |
|
813 |
|
222 |
% |
|
2,028 |
|
|
559 |
|
|
1,469 |
|
263 |
% |
|
|
Adjusted EBITDA as a % of revenue |
|
2 |
% |
|
-1 |
% |
|
|
|
4 |
% |
|
1 |
% |
|
|
|
|
Adjusted operating (loss) income (1) |
|
(30 |
) |
|
(640 |
) |
|
610 |
|
95 |
% |
|
940 |
|
|
331 |
|
|
609 |
|
184 |
% |
|
|
Adjusted (loss) / net earnings (1) |
|
(717 |
) |
|
(1,101 |
) |
|
384 |
|
35 |
% |
|
(358 |
) |
|
(1,207 |
) |
|
849 |
|
70 |
% |
|
|
Net loss |
$ |
(741 |
) |
$ |
(3,740 |
) |
$ |
2,999 |
|
80 |
% |
$ |
(382 |
) |
$ |
(3,846 |
) |
$ |
3,464 |
|
90 |
% |
|
|
Diluted per share |
|
|
|
|
|
|
|
|
|
|
Adjusted EBITDA |
$ |
0.02 |
|
$ |
(0.02 |
) |
$ |
0.03 |
|
222 |
% |
$ |
0.08 |
|
$ |
0.02 |
|
$ |
0.06 |
|
(263 |
%) |
|
|
Adjusted (loss) / net earnings |
$ |
(0.00 |
) |
$ |
(0.03 |
) |
$ |
0.03 |
|
95 |
% |
$ |
(0.01 |
) |
$ |
(0.05 |
) |
$ |
0.04 |
|
70 |
% |
|
|
Net loss |
$ |
(0.03 |
) |
$ |
(0.16 |
) |
$ |
0.13 |
|
80 |
% |
$ |
(0.02 |
) |
$ |
(0.16 |
) |
$ |
0.14 |
|
90 |
% |
|
|
|
|
|
|
|
|
|
|
|
|
|
Total assets |
|
|
|
|
$ |
59,150 |
|
$ |
81,232 |
|
$ |
(22,082 |
) |
(27 |
%) |
|
|
Working capital |
|
|
|
|
|
16,560 |
|
|
24,336 |
|
|
(7,776 |
) |
(32 |
%) |
|
|
Long-term debt |
|
|
|
|
|
9,016 |
|
|
9,625 |
|
|
(609 |
) |
(6 |
%) |
|
|
Shareholders equity |
|
|
|
|
$ |
19,325 |
|
$ |
28,756 |
|
$ |
(9,431 |
) |
(33 |
%) |
|
| |
|
|
|
|
|
|
|
|
|
Key Q2 2019 & YTD highlights include:
- Bri-Chem generated consolidated
sales of $22.7 million, a decrease of 17% from the second quarter
of 2018. The reduced revenue mainly resulted from the closure of
two underperforming West Texas warehouses in Q2 2018 and weaker
Canadian drilling activity;
- Adjusted EBITDA for the second
quarter was $447 thousand versus negative $366 thousand in the
comparable period in 2018. This 222% increase was due to
improved margins in all divisions as the Company is selling less
low margin inventory products and we are operating with lower
infrastructure costs as a result of the Company’s right sizing
initiatives based on current demand levels. In addition, we
incurred a reduction in selling general and administration costs as
a result of the adoption of IFRS 16 whereby the new IFRS standard
creates right of use assets that generates depreciation, when
previously these assets would have recorded as monthly rent.
- Adjusted operating loss was $30
thousand for the three months ended June 30, 2019 compared to a
loss of $640 thousand in the prior year comparable quarter, which
represented a 95% increase.
- Bri-Chem reported a net loss of
$741 thousand or $0.03 loss per share compared to a net loss of
$3.7 million or $0.16 loss per share in Q2 2018;
- As at June 30, 2019, working
capital was $16.6 million compared to $24.3 million at June 30,
2018, a decrease of 32%. This was due to management’s efforts
to reduce inventory levels and realize cash flow. In
addition, the adoption of IFRS 16 generated a current liability for
the obligations under finance lease for the right of use
assets. Bri-Chem’s current ratio, defined as current assets
divided by current liabilities, was 1.53 as at June 30,
2019.
Summary for the three and six months ended June 30,
2019:
Bri-Chem’s Q2 2019 consolidated sales were $22.7
million for the three months ended June 30, 2019 which was $4.5
million lower than the same prior year period. This decline
was mainly due to lower Canadian drilling activity levels in the
second quarter and the wet late start to the summer drilling
program along with the loss of revenue due to the closure of two
underperforming West Texas warehouses in Q2 2018. The revenue
decline was partially offset by an increase in well abandonment and
new cementing work in our division located in the state of
California.
Bri-Chem’s Canadian drilling fluids distribution
division generated sales of $3.6 million and $8.9 million for the
three and six months ended June 30, 2019 compared to $3.7 million
and $15.5 million in the comparable periods in 2018. The Q2
and year to date sales were lower due to the overall decline in
Canadian drilling activity and the wet late start to the summer
drilling program. The number of wells drilled in Western
Canada for the second quarter of 2019 was 806 compared to 906 in
the same period last year, representing a decrease of 11% (Source:
Petroleum Services Association of Canada “PSAC”). Bri-Chem’s
United States drilling fluids distribution division generated sales
of $14.0 million and $29.4 million compared to sales of $18.7
million and $36.7 million for the same comparable period of 2018,
representing decreases of 25% and 20% respectively. The
decreases were the result of the loss of revenue due to the closure
of two underperforming West Texas warehouses in Q2 2018.
Demand for Bri-Chem’s products and services is largely driven by
current and future North American oil and gas prices which impact
the capital drilling programs and corresponding rig activity of
Bri-Chem’s customers.
Bri-Chem’s Canadian Blending and Packaging
division generated sales of $2.0 million and $4.9 million for three
and six months ended June 30, 2019 compared to Q2 2018 sales of
$2.9 million and 2018 six month sales of $7.0 million, representing
decreases of 29% and 30% respectively. The decreases relate
to the overall decline in Canadian drilling activity which affected
demand for toll blending and bulk packaging of products over the
first half of the 2019. Conversely, Bri-Chem’s US Fluids
Blending and Packaging division experienced increases of 62%
quarter over prior year quarter and 59% year over year, as the
division recorded sales of $3.1 million and $5.4 million for the
three and six months ended June 30, 2019. These increases are
due to the increase in well abandonment work and new cementing work
in the state of California as well as the division providing cement
to customers working offshore.
Adjusted operating loss for the three months
ended June 30, 2019 was $50 thousand compared to a loss of $640
thousand during the same period last year. The infrastructure
and inventory reductions that have taken place over the first half
of 2019 have led to improved financial performance in the quarter
and year to date.
Adjusted EBITDA was $447 thousand and $2.0
million for the three and six months ended June 30, 2019 compared
to a loss of $366 thousand and positive $559 thousand for the same
comparable periods in 2018, representing increases of 222% quarter
over comparable quarter and 263% year over year. Adjusted
EBITDA as percentage of sales was 2% for Q2 2019 compared to
negative 1% for the same quarter in 2018. This increase was
due to increased sales in the US blending division, higher margins
in both fluids distribution divisions, a reduction of
infrastructure costs as part of the Company’s right sizing
initiatives implemented over the past 6 months, and the adoption of
IFRS 16 causing a reduction in rental expense for the right of use
assets.
Management’s plan to reduce debt, lower
inventory and curtail infrastructure has been on track for the
first half of 2019. Inventories have been reduced by 22%
while bank indebtedness has been reduced by 35% over the first half
of 2019.
OUTLOOK
Oilfield activity in Canada will continue to be
impacted by the limited pipeline take away capacity, lower customer
spending constraints relative to historical levels and the
corresponding lack of development of new resource plays in western
Canada. PSAC has forecasted 2,771 oil and gas wells will be drilled
in Canada for the back half of 2019, a decrease of 27% compared to
the back half of 2018 when 3,777 wells were drilled. US
drilling activity has remained consistent and therefore Bri-Chem
will continue to operate in all regions that it currently services.
We will continue to monitor drilling activity levels in Canada and
the USA and will adjust inventory levels and infrastructure based
on demand for our products.
Bri-Chem’s priorities will be to continue to
focus on controlling fixed and variable costs, improving overall
margins while maintaining a strong balance sheet. Where possible,
we will examine warehouse locations to determine if we can better
reach our customers as warehouse leases become due. We will
continue to streamline and find efficiencies in operations and
prudently manage working capital until a better business
environment emerges.
About Bri-Chem
Bri-Chem has established itself, through a
combination of strategic acquisitions and organic growth, as the
North American industry leader for wholesale distribution and
blending of oilfield drilling, completion, stimulation and
production chemical fluids. We sell, blend, package and distribute
a full range of drilling fluid products from 24 strategically
located warehouses throughout Canada and the United States.
Additional information about Bri-Chem is available at www.sedar.com
or at Bri-Chem's website at www.brichem.com.
To receive Bri-Chem news updates send your email to
ir@brichem.com.
For further information, please contact:
| Jason
TheissBri-Chem Corp.CFOT: (780)
571-8587E: jtheiss@brichem.com |
|
|
|
Neither the TSX nor its Regulation Services
Provider (as that term is defined in the policies of the TSX)
accepts responsibility for the adequacy or accuracy of this
release.
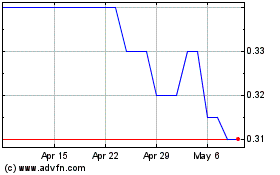
Bri Chem (TSX:BRY)
Historical Stock Chart
From Nov 2024 to Dec 2024

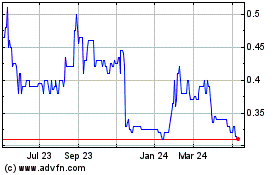
Bri Chem (TSX:BRY)
Historical Stock Chart
From Dec 2023 to Dec 2024
