Goodfellow Reports Its Results for the First Quarter Ended February 29, 2024
April 11 2024 - 4:00PM

Goodfellow Inc. (TSX: GDL) (the “Company” or “Goodfellow”)
announced today its financial results for the first quarter ended
February 29, 2024.
The Company reported a net loss of $108 thousand
or $0.01 per share compared to a net loss of $211 thousand or $0.02
per share a year ago. Consolidated sales for the three months ended
February 29, 2024 were $105.3 million compared to $105.9 million
last year.
Though under pressure from lingering inflation
and cautious consumer sentiment, Goodfellow achieved a comparable
overall financial performance in the first quarter thanks to its
diversified product offering, expertise in value-added services,
and efficient distribution systems, as well as its strong,
debt-free balance sheet. With uncertain economic conditions ahead,
the Company will continue to protect margins and seize
opportunities for growth with new and existing customers.
About Goodfellow
Goodfellow is a diversified manufacturer of
value-added lumber products, as well as a wholesale distributor of
building materials and floor coverings. Goodfellow has a
distribution footprint from coast-to-coast in Canada servicing
commercial and residential sectors through lumber yard retailer
networks, manufacturers, industrial and infrastructure project
partners, and floor covering specialists. Goodfellow also leverages
its value-added product capabilities to serve lumber markets
internationally. Goodfellow Inc. is a publicly traded company, and
its shares are listed on the Toronto Stock Exchange under the
symbol “GDL”.
|
GOODFELLOW INC. |
|
Consolidated Statements of Comprehensive
Income |
|
For the three months ended February 29, 2024 and February
28, 2023 |
|
(in thousands of dollars, except per share
amounts)Unaudited |
|
|
|
|
For the three months ended |
|
|
|
February 292024 |
|
February 282023 |
|
|
|
$ |
|
$ |
|
|
|
|
|
|
Sales |
105,334 |
|
105,925 |
|
|
Expenses |
|
|
|
Cost of goods sold |
82,546 |
|
84,260 |
|
|
Selling, administrative and general expenses |
22,884 |
|
21,684 |
|
|
Net financial costs |
55 |
|
274 |
|
|
|
105,485 |
|
106,218 |
|
|
|
|
|
|
Loss before income taxes |
(151 |
) |
(293 |
) |
|
|
|
|
|
Income taxes |
(43 |
) |
(82 |
) |
|
|
|
|
|
Total comprehensive loss |
(108 |
) |
(211 |
) |
|
|
|
|
|
Net loss per share – Basic and Diluted |
(0.01 |
) |
(0.02 |
) |
|
GOODFELLOW INC. |
|
Consolidated Statements of Financial Position |
|
(in thousands of dollars) |
|
Unaudited |
|
|
As at |
|
As at |
|
As at |
|
|
|
February 292024 |
|
November 302023 |
|
February 282023 |
|
|
|
$ |
|
$ |
|
$ |
|
|
Assets |
|
|
|
|
|
|
|
Current Assets |
|
|
|
|
|
|
|
Cash |
4,397 |
|
28,379 |
|
1,958 |
|
|
Trade and other receivables |
69,672 |
|
53,674 |
|
64,295 |
|
|
Income taxes receivable |
8,254 |
|
6,286 |
|
5,539 |
|
|
Inventories |
122,802 |
|
98,473 |
|
130,416 |
|
|
Prepaid expenses |
3,771 |
|
4,215 |
|
3,663 |
|
|
Total Current Assets |
208,896 |
|
191,027 |
|
205,871 |
|
|
|
|
|
|
|
|
|
|
Non-Current Assets |
|
|
|
|
|
|
|
Property, plant and equipment |
33,208 |
|
32,761 |
|
32,368 |
|
|
Intangible assets |
1,340 |
|
1,487 |
|
1,945 |
|
|
Right-of-use assets |
10,586 |
|
11,354 |
|
13,905 |
|
|
Defined benefit plan asset |
15,453 |
|
15,347 |
|
11,690 |
|
|
Other assets |
777 |
|
777 |
|
802 |
|
|
Total Non-Current Assets |
61,364 |
|
61,726 |
|
60,710 |
|
|
Total Assets |
270,260 |
|
252,753 |
|
266,581 |
|
|
|
|
|
|
|
|
|
|
Liabilities |
|
|
|
|
|
|
|
Current Liabilities |
|
|
|
|
|
|
|
Bank indebtedness |
11,311 |
|
- |
|
18,636 |
|
|
Trade and other payables |
44,986 |
|
37,620 |
|
39,070 |
|
|
Provision |
2,778 |
|
2,789 |
|
2,259 |
|
|
Dividends payable |
4,256 |
|
- |
|
4,274 |
|
|
Current portion of lease liabilities |
4,419 |
|
4,732 |
|
4,763 |
|
|
Total Current Liabilities |
67,750 |
|
45,141 |
|
69,002 |
|
|
|
|
|
|
|
|
|
|
Non-Current Liabilities |
|
|
|
|
|
|
|
Provision |
- |
|
- |
|
702 |
|
|
Lease liabilities |
7,878 |
|
8,497 |
|
11,272 |
|
|
Deferred income taxes |
4,112 |
|
4,112 |
|
3,431 |
|
|
Total Non-Current Liabilities |
11,990 |
|
12,609 |
|
15,405 |
|
|
Total Liabilities |
79,740 |
|
57,750 |
|
84,407 |
|
|
|
|
|
|
|
|
|
|
Shareholders’ Equity |
|
|
|
|
|
|
|
Share capital |
9,370 |
|
9,379 |
|
9,408 |
|
|
Retained earnings |
181,150 |
|
185,624 |
|
172,766 |
|
|
|
190,520 |
|
195,003 |
|
182,174 |
|
|
Total Liabilities and Shareholders’ Equity |
270,260 |
|
252,753 |
|
266,581 |
|
|
GOODFELLOW INC. |
|
Consolidated Statements of Cash Flows |
|
For the three months ended February 29, 2024 and February
28, 2023 |
|
(in thousands of dollars) Unaudited |
|
|
For the three months ended |
|
|
|
February 282024 |
|
February 282023 |
|
|
|
$ |
|
$ |
|
|
Operating Activities |
|
|
|
|
|
Net loss |
(108 |
) |
(211 |
) |
|
Adjustments for: |
|
|
|
|
|
Depreciation and amortization of: |
|
|
|
|
|
Property, plant and equipment |
835 |
|
745 |
|
|
Intangible assets |
147 |
|
151 |
|
|
Right-of-use assets |
1,034 |
|
1,257 |
|
|
Gain on disposal of property, plant and equipment |
(8 |
) |
(10 |
) |
|
Accretion expense on provision |
- |
|
68 |
|
|
Provision |
(11 |
) |
(22 |
) |
|
Income taxes |
(43 |
) |
(82 |
) |
|
Interest expense |
45 |
|
88 |
|
|
Interest on lease liabilities |
137 |
|
(18 |
) |
|
Funding in deficit of pension plan expense |
(106 |
) |
(70 |
) |
|
Other |
1 |
|
(129 |
) |
|
|
1,923 |
|
1,767 |
|
|
|
|
|
|
|
|
Changes in non-cash working capital items |
(32,510 |
) |
(16,280 |
) |
|
Interest paid |
(189 |
) |
(180 |
) |
|
Income taxes paid |
(1,925 |
) |
(3,018 |
) |
|
|
(34,624 |
) |
(19,406 |
) |
|
Net Cash Flows from Operating Activities |
(32,701 |
) |
(17,639 |
) |
|
|
|
|
|
|
|
Financing Activities |
|
|
|
|
|
Net increase in bank indebtedness |
- |
|
2,000 |
|
|
Net increase in banker’s acceptances |
- |
|
5,000 |
|
|
Payment of lease liabilities |
(1,199 |
) |
(1,505 |
) |
|
Redemption of shares |
(119 |
) |
(120 |
) |
|
Net Cash Flows from Financing Activities |
(1,318 |
) |
5,375 |
|
|
|
|
|
|
|
|
Investing Activities |
|
|
|
|
|
Acquisition of property, plant and equipment |
(1,282 |
) |
(844 |
) |
|
Proceeds on disposal of property, plant and equipment |
8 |
|
10 |
|
|
Other assets |
- |
|
- |
|
|
Net Cash Flows from Investing Activities |
(1,274 |
) |
(834 |
) |
|
|
|
|
|
|
|
Net cash outflow |
(35,293 |
) |
(13,098 |
) |
|
Cash, beginning of period |
28,379 |
|
3,420 |
|
|
Cash, end of period |
(6,914 |
) |
(9,678 |
) |
|
Cash position is comprised of: |
|
|
|
|
|
Cash |
4,397 |
|
1,958 |
|
|
Bank overdraft |
(11,311 |
) |
(11,636 |
) |
|
|
(6,914 |
) |
(9,678 |
) |
|
GOODFELLOW INC. |
|
Consolidated Statements of Changes in Shareholders’
Equity |
| For
the three months ended February 29, 2024 and February 28,
2023 |
| (in
thousands of dollars) Unaudited |
| |
|
|
ShareCapital |
|
RetainedEarnings |
|
Total |
|
|
|
$ |
|
$ |
|
$ |
|
|
|
|
|
|
|
|
|
|
Balance as at November 30, 2022 |
9,419 |
|
177,360 |
|
186,779 |
|
|
|
|
|
|
|
|
|
|
Net loss |
- |
|
(211 |
) |
(211 |
) |
|
|
|
|
|
|
|
|
|
Total comprehensive loss |
- |
|
(211 |
) |
(211 |
) |
|
|
|
|
|
|
|
|
|
|
|
|
|
|
|
|
|
Dividend |
- |
|
(4,274 |
) |
(4,274 |
) |
|
Redemption of Shares |
(11 |
) |
(109 |
) |
(120 |
) |
|
|
|
|
|
|
|
|
|
Balance as at February 28, 2023 |
9,408 |
|
172,766 |
|
182,174 |
|
|
|
|
|
|
|
|
|
|
|
|
|
|
|
|
|
|
|
|
|
|
|
|
|
|
Balance as at November 30, 2023 |
9,379 |
|
185,624 |
|
195,003 |
|
|
|
|
|
|
|
|
|
|
Net loss |
- |
|
(108 |
) |
(108 |
) |
|
|
|
|
|
|
|
|
|
Total comprehensive loss |
- |
|
(108 |
) |
(108 |
) |
|
|
|
|
|
|
|
|
|
Dividend |
- |
|
(4,256 |
) |
(4,256 |
) |
|
Redemption of Shares |
(9 |
) |
(110 |
) |
(119 |
) |
|
|
|
|
|
|
|
|
|
Balance as at February 29, 2024 |
9,370 |
|
181,150 |
|
190,520 |
|
Patrick Goodfellow President and CEO T: 450 635-6511 F: 450
635-3730 info@goodfellowinc.com
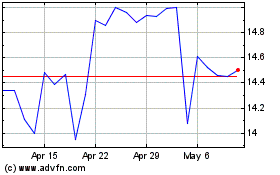
Goodfellow (TSX:GDL)
Historical Stock Chart
From Dec 2024 to Jan 2025

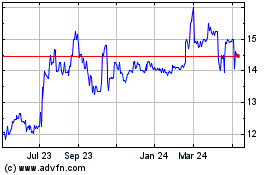
Goodfellow (TSX:GDL)
Historical Stock Chart
From Jan 2024 to Jan 2025
