Partners Value Investments L.P. Announces Q2 2022 Interim Results
August 23 2022 - 4:00PM

Partners Value Investments L.P. (the “Partnership” TSX: PVF.UN
TSX:PVF.PR.U) announced today its financial results for the three
months ended June 30, 2022. All amounts are stated in US dollars.
The Partnership recorded net income of $21.0
million for the quarter ended June 30, 2022, compared to net income
of $28.5 million in the prior year quarter. The decrease in income
was primarily due to lower income from dividends, as a result of
the one-time special dividend in the prior year quarter from the
spin-off of Brookfield Asset Management Reinsurance Partners Ltd,
and was partially offset by foreign currency gains and tax
recoveries. Income of $19.3 million was attributable to the Equity
Limited Partners ($0.24 per Equity LP unit) and income of $1.7
million was attributable to preferred limited partners.
The market price of a Brookfield Asset
Management Inc. (“Brookfield”) share was $44.47 per share at June
30, 2022 (December 2021 – $60.38). The market price of a Brookfield
share was $51.02 on August 22, 2022.
Consolidated Statements of
Operations
| (Unaudited)For the period
ended June 30 |
Three Months Ended |
|
Six Months Ended |
|
(Thousands, US dollars) |
|
2022 |
|
|
|
2021 |
|
|
|
2022 |
|
|
|
2021 |
|
|
Investment income |
|
|
|
|
|
|
|
|
|
|
|
|
Dividends |
$ |
19,103 |
|
|
$ |
63,389 |
|
|
$ |
38,247 |
|
|
$ |
81,892 |
|
|
Other investment income |
|
924 |
|
|
|
1,035 |
|
|
|
1,820 |
|
|
|
3,044 |
|
| |
|
20,027 |
|
|
|
64,424 |
|
|
|
40,067 |
|
|
|
84,936 |
|
| Expenses |
|
|
|
|
|
|
|
|
|
|
|
|
Operating expenses |
|
(761 |
) |
|
|
(830 |
) |
|
|
(1,626 |
) |
|
|
(1,535 |
) |
|
Financing costs |
|
(2,547 |
) |
|
|
(2,966 |
) |
|
|
(5,014 |
) |
|
|
(4,250 |
) |
|
Retractable preferred share dividends |
|
(10,454 |
) |
|
|
(7,678 |
) |
|
|
(18,867 |
) |
|
|
(19,218 |
) |
| |
|
6,265 |
|
|
|
52,950 |
|
|
|
14,560 |
|
|
|
59,933 |
|
| Other items |
|
|
|
|
|
|
|
|
|
|
|
|
Investment valuation gains (loss) |
|
(3,441 |
) |
|
|
709 |
|
|
|
13,242 |
|
|
|
5,993 |
|
|
Amortization of deferred financing costs |
|
(886 |
) |
|
|
(1,333 |
) |
|
|
(1,652 |
) |
|
|
(2,537 |
) |
|
Current taxes recovery (expense) |
|
115 |
|
|
|
265 |
|
|
|
(20,175 |
) |
|
|
2,245 |
|
|
Deferred taxes recovery (expense) |
|
3,779 |
|
|
|
(5,544 |
) |
|
|
15,323 |
|
|
|
(8,171 |
) |
|
Foreign currency (losses) gain |
|
15,176 |
|
|
|
(18,555 |
) |
|
|
9,689 |
|
|
|
(30,146 |
) |
|
Net income |
$ |
21,008 |
|
|
$ |
28,492 |
|
|
$ |
30,987 |
|
|
$ |
27,317 |
|
|
|
|
|
|
|
|
|
|
|
|
|
|
|
|
|
|
Change in Net Book Value
The information in the following table shows the
changes in net book value:
|
UnauditedFor the period ended June 30(Thousands, except per unit
amounts) |
Three Months Ended |
|
Six Months Ended |
|
|
Total |
|
|
|
Per Unit |
|
|
|
Total |
|
|
|
Per Unit |
|
|
Net book value, beginning of period1 |
$ |
7,000,550 |
|
|
|
79.39 |
|
|
$ |
7,482,738 |
|
|
$ |
85.35 |
|
| Net
income2 |
|
19,286 |
|
|
|
0.24 |
|
|
|
27,543 |
|
|
|
0.34 |
|
| Other
comprehensive income2 |
|
(1,596,902 |
) |
|
|
(19.75 |
) |
|
|
(2,089,799 |
) |
|
|
(25.84 |
) |
|
Adjustment for impact of warrant3 |
|
(10,833 |
) |
|
|
(0.14 |
) |
|
|
(6,933 |
) |
|
|
(0.09 |
) |
|
Equity LP repurchase |
|
(1,473 |
) |
|
|
(0.02 |
) |
|
|
(2,921 |
) |
|
|
(0.04 |
) |
| Net
book value, end of period1, 4,5 |
$ |
5,410,628 |
|
|
$ |
59.72 |
|
|
$ |
5,410,628 |
|
|
$ |
59.72 |
|
|
|
|
|
|
|
|
|
|
|
|
|
|
|
|
|
|
- Calculated on a fully diluted
basis. Net book value is a non-IFRS measure used by management to
measure the value of an Equity LP unit on a fully diluted basis. It
is equal to total equity less General Partner equity and Preferred
Limited Partners’ equity, plus the value of consideration to be
received on exercising of warrants, which as at June 30, 2022 was
$371 million (December 31, 2021 – $378 million).
- Attributable to Equity Limited
Partners.
- The basic weighted average number
of Equity Limited Partnership (“Equity LP”) units outstanding
during the period ended June 30 was 66,187,069. The diluted
weighted average number of Equity Limited Partnership (“Equity LP”)
units available and outstanding for the three months ended June 30,
2022 was 80,894,554; this includes the 14,707,485 Equity LP units
issued through the exercise of all outstanding warrants.
- At the end of the period, the
diluted Equity LP units outstanding were 80,870,467 (December 31,
2021 – 82,171,127).
- Net book value excludes amounts
attributable to non-controlling interests.
Financial Profile
The Partnership’s principal investment is its
interest in approximately 130 million Class A Limited Voting Shares
(“Brookfield shares”) of Brookfield. This represents approximately
a 8% interest as at June 30, 2022. In addition, the Company owns a
diversified investment portfolio of marketable securities.
The information in the following table has been
extracted from the Partnership’s Statement of Financial
Position:
|
As at(Thousands, US dollars) |
|
(Unaudited)June 30, 2022 |
|
|
|
December 31, 2021 |
|
|
Assets |
|
|
|
|
|
|
|
| Cash and
cash equivalents |
$ |
237,888 |
|
|
$ |
80,704 |
|
| Accounts
receivable and other assets |
|
29,410 |
|
|
|
65,418 |
|
|
Investment in Brookfield Asset Management Inc. 1 |
|
5,796,037 |
|
|
|
7,869,681 |
|
| Other
investments carried at fair value |
|
336,214 |
|
|
|
344,983 |
|
|
|
$ |
6,399,549 |
|
|
$ |
8,360,786 |
|
|
Liabilities and Equity |
|
|
|
|
|
|
|
| Accounts
payable and other liabilities |
$ |
25,048 |
|
|
$ |
7,693 |
|
|
Corporate Borrowings |
|
232,178 |
|
|
|
236,513 |
|
|
Preferred shares2 |
|
938,447 |
|
|
|
835,019 |
|
| Deferred
taxes3 |
|
961 |
|
|
|
23,431 |
|
|
|
|
1,196,634 |
|
|
|
1,102,656 |
|
|
Equity |
|
|
|
|
|
|
|
| Equity
Limited Partners |
|
5,039,898 |
|
|
|
7,105,075 |
|
| General
Partner |
|
1 |
|
|
|
1 |
|
|
Preferred Limited Partners |
|
153,054 |
|
|
|
153,054 |
|
|
Non-controlling interests |
|
9,962 |
|
|
|
- |
|
|
|
$ |
6,399,549 |
|
|
$ |
8,360,786 |
|
|
|
|
|
|
|
|
|
|
- The investment in
Brookfield Asset Management Inc. consists of approximately 130
million Brookfield with a quoted market value of $44.47 per share
as at June 30, 2022 (December 31, 2021 – $60.38).
- Represents $717 million of
retractable preferred shares less $15 million of unamortized issue
costs as at June 30, 2022 (December 31, 2021 – $612 million
less $13 million), $152 million of three series of preferred shares
(December 31, 2021 - $152 million) and $84 million of three series
of preferred shares (December 31, 2021 - $84 million) of a
subsidiary of the Partnership, issued in December 2021
- The deferred tax liability
represents the potential future income tax liability of the
Partnership recorded for accounting purposes based on the
difference between the carrying values of the Partnership’s assets
and liabilities and their respective tax values, as well as giving
effect to estimated capital and non-capital losses.
For further information, contact Investor
Relations at 416-956-5141.
Note: This news release contains
“forward-looking information” within the meaning of Canadian
provincial securities laws and “forward-looking statements” within
the meaning of applicable Canadian securities regulations. The
words “potential” and “estimated” and other expressions which are
predictions of or indicate future events, trends or prospects and
which do not relate to historical matters, identify forward-looking
information. Forward-looking information in this news release
includes statements with regard to the Company’s potential future
income taxes.
Although the Company believes that its
anticipated future results, performance or achievements expressed
or implied by the forward-looking statements and information are
based upon reasonable assumptions and expectations, the reader
should not place undue reliance on forward-looking statements and
information because they involve known and unknown risks,
uncertainties and other factors, many of which are beyond its
control, which may cause the actual results, performance or
achievements of the Company to differ materially from anticipated
future results, performance or achievement expressed or implied by
such forward-looking statements and information.
Factors that could cause actual results to
differ materially from those contemplated or implied by
forward-looking statements and information include, but are not
limited to: the financial performance of Brookfield Asset
Management Inc., the impact or unanticipated impact of general
economic, political and market factors; the behavior of financial
markets, including fluctuations in interest and foreign exchanges
rates; global equity and capital markets and the availability of
equity and debt financing and refinancing within these markets;
strategic actions including dispositions; changes in accounting
policies and methods used to report financial condition (including
uncertainties associated with critical accounting assumptions and
estimates); the effect of applying future accounting changes;
business competition; operational and reputational risks;
technological change; changes in government regulation and
legislation; changes in tax laws, catastrophic events, such as
earthquakes and hurricanes; the possible impact of international
conflicts and other developments including terrorist acts; and
other risks and factors detailed from time to time in the Company’s
documents filed with the securities regulators in Canada.
The Company cautions that the foregoing list of
important factors that may affect future results is not exhaustive.
When relying on the Company’s forward-looking statements and
information, investors and others should carefully consider the
foregoing factors and other uncertainties and potential events.
Except as required by law, the Company undertakes no obligation to
publicly update or revise any forward-looking statements and
information, whether written or oral, that may be as a result of
new information, future events or otherwise.
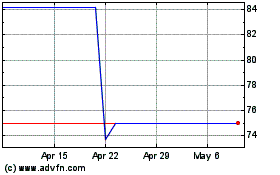
Partners Value Investments (TSXV:PVF.UN)
Historical Stock Chart
From Dec 2024 to Jan 2025

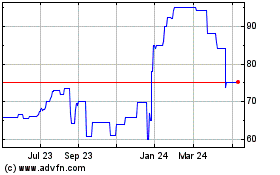
Partners Value Investments (TSXV:PVF.UN)
Historical Stock Chart
From Jan 2024 to Jan 2025
