$3.3 Million in Revenue with its
10th Consecutive Profitable Quarter
LiveWorld, Inc. (OTC Markets: LVWD), today announced the
financial results for the quarter ended September 30, 2013. Total
revenues were $3.3 million for the quarter as compared to the $3.4
million for the quarter ended September 30, 2012. This was a
decrease of approximately $100,000 or 3% period-over-period. The
Company’s revenues for the nine months ended September 30, 2013
were approximately $10.9 million, as compared to $9.2 million for
the nine months ended September 30, 2012. This was an increase of
approximately $1.7 million or 19% period-over-period.
The Company reported net income for the quarter of $146,000, or
5% of total revenues. This result was a decrease of $266,000 when
compared to the net income of $412,000, or 12% reported for the
quarter ended September 30, 2012. The Company’s net income for the
nine months ended September 30, 2013 was approximately $709,000, as
compared to the net income of $1.1 million for the nine months
ended September 30, 2012.
LiveWorld ended the quarter with approximately $4.8 million in
cash and cash equivalents. The Company reported a positive working
capital balance of approximately $3.6 million for the quarter ended
September 30, 2013 as compared to the $2.8 million it had for the
quarter ended December 31, 2012. LiveWorld anticipates it will be
cash negative in the fourth quarter of 2013 as it continues to
expand its development, sales, and marketing efforts.
“We continued to demonstrate consistent financial performance
with our 10th consecutive profitable quarter. We have been able to
expand our relationship with existing clients, while we continue to
accelerate our sales, marketing, and development efforts,” said
David Houston, Chief Financial Officer of LiveWorld. “We anticipate
top line revenue growth for 2013 which positions us well as we move
into 2014.”
Detailed quarterly financial information may be downloaded at
www.liveworld.com (financials page) or at www.otcmarkets.com.
About LiveWorld
LiveWorld is a social content marketing company. Through
engagement, moderation, and insight we help brands develop deeper
relationships with customers. We bring a human touch scaled by
technology that creates value out of user content and provides big
cost savings. By providing software and services, LiveWorld
delivers a full range of social media solutions.
The LiveWorld Social Content Marketing Suite (SCMS) is based on
a software platform designed to engage human quality at every
level, while cost effectively scaling across social channels. The
suite includes three applications: LiveEngage, LiveMod, and
LiveInsight. These applications empower people to moderate and
respond to user comments, and to analyze data with human
intelligence and sensitivity in context.
LiveWorld is a trusted partner to clients in developing
strategy, creating and publishing content, engaging customers,
moderating content, managing crises, and gleaning insight from
social media.
LiveWorld is headquartered in California, with offices in San
Jose, CA and NY. www.liveworld.com. Follow us at @LiveWorld.
“Safe Harbor" Statement Under The
Private Securities Litigation Reform Act
This press release may contain forward-looking information
concerning LiveWorld's plans, objectives, future expectations,
forecasts and prospects. These statements may include those
regarding LiveWorld’s current or future financial performance
including but not limited to lists of clients, revenue and profit,
use of cash, investments, relationships and the actual or potential
impact of stock option expense, and the results of its product
development efforts. The balance sheet, operating results, and
statements of cash flows for the periods ended September 30, 2012
and 2013 and the period ended December 31, 2012 where neither
audited nor reviewed by an independent accounting firm and are
subject to change upon such a review or audit being completed.
Actual results may differ materially from those expressed in the
forward looking statements made as a result of, among other things,
final accounting adjustments and results, LiveWorld’s ability to
attract new clients and preserve or expand its relationship with
existing clients, LiveWorld’s ability to retain and attract high
quality employees, including its management staff, the ability to
deliver new innovative products in a timely manner, changing
accounting treatments, and other risks applicable to the Company.
Readers are cautioned not to place undue reliance on these
forward-looking statements, which speak only as of the date hereof,
and the Company undertakes no obligation to update these
forward-looking statements to reflect subsequent events or
circumstances.
LIVEWORLD, INC. UNAUDITED CONDENSED BALANCE
SHEETS (In thousands, except share data)
September 30, December 31, 2013
2012 ASSETS Current assets Cash and cash equivalent $
4,825 $ 3,382 Accounts receivable, net 2,535 1,415 Prepaid expenses
296 268 Total current assets 7,656 5,065
Property and equipment, net 263 234 Other assets 17
17 Total assets $ 7,936 $ 5,316
LIABILITIES AND STOCKHOLDERS'
EQUITY Current liabilities Accounts payable $ 372 $ 235 Accrued
employee expenses 602 504 Other accrued liabilities 18 17 Deferred
revenue 3,062 1,478 Total current liabilities
4,054 2,234 Total liabilities 4,054 2,234
Stockholders' equity Common stock: $0.001 par value, 100,000,000
shares authorized 33,257,634 issued and outstanding as of December
31, 2012 and September 30, 2013 respectively 33 33
Additional paid-in capital 141,269 141,178 Accumulated deficit
(137,420) (138,129) Total stockholders' equity
3,883 3,082 Total liabilities and stockholders' equity $
7,936 $ 5,316
LIVEWORLD, INC. UNAUDITED
CONDENSED STATEMENT OF OPERATIONS (In thousands, except per
share data)
Three Months EndedSeptember
30,
Nine Months EndedSeptember
30,
2013 2012 2013 2012 Total revenues $
3,319 $ 3,419 $ 10,926 $ 9,207 Cost of revenues 931
1,121 3,342 2,972 Gross Margin 2,388 2,298 7,583
6,235 Operating Expense Product development 429 519 1,478 1,341
Sales and marketing 1,038 824 3,163 2,208 General and
administrative 735 524 2,124 1,543 Stock based compensation
34 21 92 58 Total operating expense
2,237 1,888 6,857 5,150 Profit from operations
151 410 726 1,085 Other income ---- 2 1
12 Profit before tax 151 412 727 1,097 Provision for income taxes
(5) ---- (18) (2) Net income 146
412 709 1,095 Basic net income per
share $ 0.00 $ 0.01 $ 0.02 $ 0.03 Shares used in computing basic
net income per share 33,257,634 33,229,373 33,257,634 33,200,134
Diluted net income per share $ 0.00 $ 0.01 $ 0.02 $ 0.03 Shares
used in computing diluted income (loss) per share 42,729,309
43,374,457 44,120,684 40,984,408 Departmental allocation of
stock-based compensation: Product development $ 10 $ 8 $ 32 $ 25
Sales and marketing 10 8 25 19 General and administrative 14
5 35 14 Total stock-based compensation $ 34 $
21 $ 92 $ 58
LIVEWORLD, INC. UNAUDITED
CONDENSED STATEMENTS OF CASH FLOWS (In thousands)
Three Months EndedSeptember
30,
Nine Months EndedSeptember
30,
2013 2012 2013
2012 Cash flows from operating activities: Net income $ 146
$ 412 $ 709 $ 1,095 Adjustments to reconcile net income
provided by (used in) operating
activities:
Depreciation of long-lived assets 37 22 97 61 Stock-based
compensation 34 21 92 58 Changes in operating assets and
liabilities: Accounts receivable 592 (252) (1,120) (1,549) Other
assets 44 (3) (28) (13) Accounts payable 129 (70) 137 190 Accrued
liabilities (53) 114 99 287 Deferred revenue 46 151
1,584 2,201 Net cash provided by (used in) operating
activities 974 395 1,569 2,330 Cash
flows from investing activities: Purchase of property and equipment
(8) (59) (126) (148) Net cash provided
by (used in) investing activities (8) (59)
(126) (148) Cash flows from financing activities: Proceeds
from exercise of stock options ---- 2 ---- 2 Note payable financing
---- ---- ---- (15) Net cash provided
by (used for) financing activities ---- 2 ---- (13) Change in cash
and cash equivalent 966 338 1,443 2,169 Cash and cash equivalents,
beginning of period 3,859 3,154 3,382
1,323 Cash and cash equivalents, end of period $ 4,825 $ 3,492 $
4,825 $ 3,492
IR:LiveWorldDavid Houston,
408-615-8496dhouston@liveworld.comorPR:TallGrass PRErica Rutan,
908-684-4332erica.rutan@tallgrasspr.com
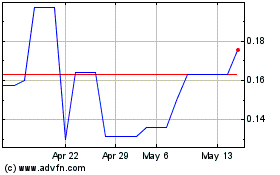
LiveWorld (PK) (USOTC:LVWD)
Historical Stock Chart
From Dec 2024 to Jan 2025

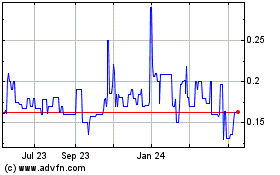
LiveWorld (PK) (USOTC:LVWD)
Historical Stock Chart
From Jan 2024 to Jan 2025
