TIDMJLH
RNS Number : 6894U
John Lewis Of Hungerford PLC
30 March 2023
The information contained within this announcement is deemed to
constitute inside information as stipulated under the retained EU
law version of the Market Abuse Regulation (EU) No. 596/2014 (the
"UK MAR") which is part of UK law by virtue of the European Union
(Withdrawal) Act 2018. The information is disclosed in accordance
with the Company's obligations under Article 17 of the UK MAR. Upon
the publication of this announcement, this inside information is
now considered to be in the public domain.
30 March 2023
John Lewis of Hungerford plc
(the "Company")
Half-year report
John Lewis of Hungerford Plc (AIM: JLH), the specialist
manufacturer and retailer of kitchens, bedrooms and freestanding
furniture, is pleased to announce its unaudited interim results for
the six months ended 31 December 2022.
Overview
The Company is pleased to report that the revenue for the half
year to 31 December 2022 of GBP5.4 million (2021: GBP4.6 million)
reflected an improvement of 18% over the corresponding period in
2021 and a 60% growth over the pre-pandemic half year period to 31
December 2019. The total of dispatched sales and confirmed forward
orders for the first 38 weeks of trading in the current financial
year stands at GBP9.2 million (2022: GBP8.5 million).
The underlying adjusted loss before tax* for the half year to 31
December 2022, was GBP105k (2021: Loss before tax GBP81k). In the
2022 calendar year, the Company experienced substantial and sudden
increases in costs of some key raw materials. The Company took
swift action to raise prices on all new orders from the start of
the 2022/23 financial year in order to offset cost increases.
However, it should be noted that the average lead time between
taking an order and completing the installation and recognising the
sale is six months. The sales recognised in the first half of the
current financial year were predominantly at the previous retail
prices before any price increase had been applied, and consequently
the gross margin was lower at 42% (FY2021/22: 45%). The Board
expects that the gross margin in the second half of the current
financial year will benefit from these price increases, which
customers have accepted as necessary and market standard increases,
and be closer to its historic run rate. The Board also notes that
the significant cost pressures suffered in 2022 are easing, as the
current year progresses, with the management team focused on
increasing the gross margin through improved purchasing and
improving operational efficiencies.
The movement in administration costs is split between additional
infrastructure costs in the support functions which have been
strengthened to enable the front-line team to focus on conversion;
and delivering an unrivalled customer experience. The high levels
of quoted business throughout the first half of the financial year
demonstrate the brand continuing to build on its digital reach and
share of voice in all online platforms. Investment to optimise the
website experience for mobile devices has been instrumental in the
increase in enquiries into the business. Additional investments in
the Company's production capacity, through the recruitment and
development of a larger team, will allow the Company to capitalise
on a traditionally busier second half year.
*Loss before tax and non-recurring costs of GBP105k is after
adjusting for GBP69k of one-off, non-recurring costs which occurred
in the half year to 31 December 2022, which are not expected to be
repeated going forward. These non-recurring costs are related to
project and one-off restructuring costs. Reported unaudited loss
before tax for the half year to 31 December 2022 was GBP174k.
Outlook
As stated above, the dispatched sales and confirmed orders
(which the Board believes to be the best measure of trading) for
the first 38 weeks of trading of the current financial year stood
at GBP9.2 million (2022: GBP8.5 million). Future orders, against
which a first stage deposit has been taken, are tracking the prior
year and the Board's central scenario is to deliver a cGBP12
million full year revenue performance, which the Board believes
would result in the profit before tax and non-recurring costs being
ahead of the prior year.
Kiran Noonan
Chief Executive Officer and Acting Chairman
29 March 2023
Enquiries:
John Lewis of Hungerford plc 01235 774300
Kiran Noonan - Chief Executive Officer and Acting Chairman
Allenby Capital Limited (Nominated Adviser and Broker) 020 3328
5656
David Worlidge / Nick Naylor / George Payne (Corporate
Finance)
Matt Butlin / Amrit Nahal (Sales and Corporate Broking)
 INCOME STATEMENT
 FOR THE SIX MONTHSED 31 DECEMBER
  2022

                                                                 Audited
                                      Unaudited 6 months            Year
                                             ended                 ended
                                  31 December     31 December    30 June
                                         2022            2021       2022

                                      GBP'000         GBP'000    GBP'000

 Revenue                                5,374           4,561     10,325
                                 ------------  --------------   --------

 Cost of sales                        (3,102)         (2,530)    (5,580)

 Gross profit                           2,272           2,031      4,745

 Selling and distribution
  costs                                 (223)           (245)      (546)

 Administration expenses:
  Other                               (2,099)         (1,758)    (3,968)
  Other operating income                    -               3          2
                                 ------------  --------------   --------
 Total                                (2,099)         (1,755)    (3,966)

 (Loss)/Profit from operations           (50)              31        233

 Finance expenses                       (124)           (112)      (219)

 (Loss)/Profit before tax               (174)            (81)         14

 Taxation                                   -               -          -

 (Loss)/Profit after taxation           (174)            (81)         14
                                 ============  ==============   ========

 (Loss)/Earnings per share
 Basic                                (0.09)p         (0.04)p      0.01p
 Fully diluted                        (0.08)p         (0.04)p      0.01p


   STATEMENT OF COMPREHENSIVE INCOME
 FOR THE SIX MONTHSED 31 DECEMBER
  2022

                                                                  Audited
                                         Unaudited 6 months          Year
                                                ended               ended
                                      31 December   31 December   30 June
                                             2022          2021      2022

                                          GBP'000       GBP'000   GBP'000

 (Loss)/Profit for the
  period                                    (174)          (81)        14

 Revaluation of freehold
  land and buildings                            -             -       584

 Total Comprehensive (Loss)/Income          (174)          (81)       598
                                     ============  ============  ========


 BALANCE SHEET
 AS AT 31 DECEMBER 2022
                                              Unaudited                             Audited
                                                 As at                                As at
                                     31 December          31 December               30 June
                                            2022                 2021                  2022
                                         GBP'000              GBP'000               GBP'000
 Non-Current Assets
 Intangible assets                           128                  124                   148
 Tangible assets                           4,547                3,811                 4,705
 Trade and other receivables                  32                   32                    32
                                                                           ----------------
                                           4,707                3,966                 4,885
                                ----------------  -------------------      ----------------

 Current assets
 Inventories                                 234                  167                   252
 Trade and other receivables               1,712                1,140                 1,864
 Deferred Tax asset                           82                   82                    82
 Cash and cash equivalents                   680                  824                 1,473
                                ----------------  -------------------      ----------------
                                           2,708                2,214                 3,671


 Current liabilities                     (3,639)              (3,070)               (4,484)

 Net current liabilities                   (931)                (856)                 (813)
                                ----------------  -------------------      ----------------

 Total assets less current
 liabilities                               3,776                3,110                 4,072


 Non-current liabilities
 Borrowings                              (1,102)              (1,127)               (1,116)
 Lease Liabilities                       (1,401)              (1,208)               (1,503)
 Provisions for liabilities
 and charges                                (47)                 (53)                  (53)

 Net Assets                                1,226                  722                 1,400
                                ================  ===================      ================

 Equity
 Share capital                               194                  194                   194
 Other reserves                                1                    1                     1
 Share premium account                     1,222                1,222                 1,222
 Revaluation Reserve                       1,102                  518                 1,102
 Retained Earnings                       (1,293)              (1,214)               (1,119)

 Total Equity                              1,226                  722                 1,400
                                ================  ===================      ================


 STATEMENT OF CHANGES IN EQUITY
 FOR THE SIX MONTHS ENDED 31 DECEMBER
  2022

                                      Share             Share        Other      Revaluation     Retained
                                    Capital           Premium     Reserves         Reserves     Earnings       Total
-------------------------  ----------------  ----------------  -----------  ---------------  -----------  ----------

                                    GBP'000           GBP'000      GBP'000          GBP'000      GBP'000     GBP'000

 At 30 June 2021
  (Audited)                         194          1,222                  1         518       (1,132)         803
 Loss for the period                  -              -                  -           -          (81)        (81)
 At 31 December 2021
  (Unaudited)                       194          1,222                  1         518       (1,213)         722
                           ============  =============  =================  ==========  ============  ==========
 Profit for the period                -              -                  -           -            94          94
 Share issue                          -              -                  -           -             -           -
 Revaluation of freeholds             -              -                  -         584             -         584
 Deferred tax on                      -              -                  -           -             -           -
 Revaluation
 of freeholds
 Share based payments                 -              -                  -           -             -           -
 At 30 June 2022
  (Audited)                         194          1,222                  1       1,102       (1,119)       1,400

 Loss for the period                  -              -                  -           -         (174)       (174)
 At 31 December 2022
  (Unaudited)                       194          1,222                  1       1,102       (1,293)       1,226
                           ============  =============  =================  ==========  ============  ==========


 STATEMENT OF CASH FLOWS
 FOR THE SIX MONTHS ENDED 31 DECEMBER
  2022


                                                  Unaudited 6 months
                                                         ended                 Audited
                                                                            Year ended
                                               31 December   31 December       30 June
                                                      2022          2021          2022

                                                   GBP'000       GBP'000       GBP'000

 (Loss)/Profit from operations                        (51)            31           233

 Depreciation, impairment, and amortisation            259           239           466
 Decrease/(Increase) in inventories                      -            26          (58)
 Decrease/(Increase) in receivables                    170         (271)         (995)
 (Decrease)/Increase in payables                     (331)         (506)           377
 (Decrease)/Increase in Customer Deposits            (475)           298           791
 Loss/(Profit) on disposal of property
  plant and equipment                                  (8)             0             2
 Decrease in provisions                                  -             -           (6)


 Net cash from operating activities                  (436)         (183)           809

 Cash flows from financing activities                (284)         (263)         (505)

 Cash flows from investing activities                 (73)          (32)         (133)


   Net (decrease)/increase in cash and
   cash equivalents                                  (793)         (478)           171
 Net cash and cash equivalents at the
  start of the period                                1,473         1,302         1,302
 Net cash and cash equivalents at the
  end of the period                                    680           824         1,473
                                              ============  ============  ============


   NOTES:

 1. This interim financial statement has been prepared on the basis
  of accounting policies adopted by the Company and set out in the
  annual report and accounts for the year ended 30 June 2022. The Company
  does not anticipate any change in these accounting policies for the
  year ending 30 June 2023. As permitted, this interim report has been
  prepared in accordance with the AIM Rules and not in accordance with
  IAS 34 "Interim financial reporting". The principal risks and uncertainties
  facing the Company are disclosed in the Company's financial statements
  for the year ended 30 June 2022, available from www.john-lewis.co.uk
  and remain unchanged.
 2. Loss/Earnings per share
  Basic and fully diluted loss per ordinary share is calculated as
  follows:

                                                   6 months      6 months          Year
                                                      ended         ended         ended
                                                31 December   31 December       30 June
                                                       2022          2021          2022

 (Loss/Profit attributable to ordinary
  shareholders (GBP'000)                              (174)          (81)            14
 Weighted average number
  of shares in issue                            193,945,519   193,945,519   193,945,519
 Shares used to calculate diluted earnings
  per share                                     211,424,385   193,945,519   211,424,385

 Basic(loss)/earnings per
  ordinary share (pence)                            (0.09)p       (0.04)p         0.01p
 Diluted (loss)/earnings
  per ordinary share (pence)                        (0.08)p       (0.04)p         0.01p


 3. Availability of the 2022 Interim accounts
  Copies of the interim accounts for the six months ended 31 December
  2022 will be available to shareholders on the Company's website -
  www.john-lewis.co.uk
This information is provided by RNS, the news service of the
London Stock Exchange. RNS is approved by the Financial Conduct
Authority to act as a Primary Information Provider in the United
Kingdom. Terms and conditions relating to the use and distribution
of this information may apply. For further information, please
contact rns@lseg.com or visit www.rns.com.
RNS may use your IP address to confirm compliance with the terms
and conditions, to analyse how you engage with the information
contained in this communication, and to share such analysis on an
anonymised basis with others as part of our commercial services.
For further information about how RNS and the London Stock Exchange
use the personal data you provide us, please see our Privacy
Policy.
END
IR BIGDXGGDDGXC
(END) Dow Jones Newswires
March 30, 2023 02:00 ET (06:00 GMT)
John Lewis Of Hungerford (LSE:JLH)
Historical Stock Chart
From Feb 2025 to Mar 2025

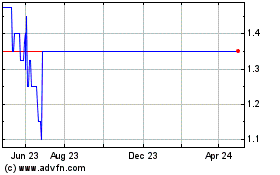
John Lewis Of Hungerford (LSE:JLH)
Historical Stock Chart
From Mar 2024 to Mar 2025
