Half Yearly Report -3-
June 21 2012 - 1:58AM
UK Regulatory
                                             reserve       earnings          Total
-------------------------------------  -------------  -------------  -------------
                                                 GBP            GBP            GBP
-------------------------------------  -------------  -------------  -------------

 Balance at 1 October 2010                  (10,508)    (1,063,118)      4,624,034
-------------------------------------  -------------  -------------  -------------
 Other comprehensive income -
-------------------------------------  -------------  -------------  -------------
 exchange differences on translating
-------------------------------------  -------------  -------------  -------------
 foreign operations                          (3,657)              -        (3,657)
-------------------------------------  -------------  -------------  -------------
 Loss for the period                               -      (421,132)      (421,132)
-------------------------------------  -------------  -------------  -------------
 Total comprehensive income                  (3,657)      (421,132)      (424,789)
-------------------------------------  -------------  -------------  -------------
 Issue of share capital
-------------------------------------  -------------  -------------  -------------
 (net of expenses)                                 -              -      2,449,958
-------------------------------------  -------------  -------------  -------------
 Balance at 31 March 2011                   (14,165)    (1,484,250)      6,649,203
-------------------------------------  -------------  -------------  -------------
 Balance at 1 April 2011                    (14,165)    (1,484,250)      6,649,203
-------------------------------------  -------------  -------------  -------------
 Other comprehensive income -
-------------------------------------  -------------  -------------  -------------
 exchange differences on translating
-------------------------------------  -------------  -------------  -------------
 foreign operations                         (70,999)              -       (70,999)
-------------------------------------  -------------  -------------  -------------
 Loss for the period                               -    (3,270,429)    (3,270,429)
-------------------------------------  -------------  -------------  -------------
 Total comprehensive income                 (70,999)    (3,270,429)    (3,341,428)
-------------------------------------  -------------  -------------  -------------
 Share based options                               -              -        424,570
-------------------------------------  -------------  -------------  -------------
 Issue of share capital (net of
-------------------------------------  -------------  -------------  -------------
 expenses)                                         -              -      1,003,857
-------------------------------------  -------------  -------------  -------------
 Balance at 30 September 2011               (85,164)    (4,754,679)      4,736,202
-------------------------------------  -------------  -------------  -------------
 Other comprehensive income -
-------------------------------------  -------------  -------------  -------------
 exchange differences on translating
-------------------------------------  -------------  -------------  -------------
 foreign operations                         (11,988)              -       (11,988)
-------------------------------------  -------------  -------------  -------------
 Loss for the period                               -      (243,038)      (243,038)
-------------------------------------  -------------  -------------  -------------
 Total comprehensive income                 (11,988)      (243,038)      (255,026)
-------------------------------------  -------------  -------------  -------------
 Issue of share capital (net of
-------------------------------------  -------------  -------------  -------------
 expenses)                                         -              -        712,499
-------------------------------------  -------------  -------------  -------------
 Balance at 31 March 2012                   (97,152)    (4,997,717)      5,193,675
-------------------------------------  -------------  -------------  -------------
Unaudited condensed consolidated interim statement of cash
flow
For the six months ended 31 March 2012
                                            6 months      6 months       12 months
                                                  to            to              to
--------------------------------------  ------------  ------------  --------------
                                            31 March      31 March    30 September
--------------------------------------  ------------  ------------  --------------
                                                2012          2011            2011
--------------------------------------  ------------  ------------  --------------
                                                 GBP           GBP             GBP
--------------------------------------  ------------  ------------  --------------

 Operating loss for the period             (243,038)     (421,132)     (3,691,561)
--------------------------------------  ------------  ------------  --------------
 Adjusted for:
--------------------------------------  ------------  ------------  --------------
 Depreciation                                      -           563           1,306
--------------------------------------  ------------  ------------  --------------
 Investment revenue                          (2,372)             -         (7,248)
--------------------------------------  ------------  ------------  --------------
 Foreign exchange loss                      (11,988)       (3,657)        (74,656)
--------------------------------------  ------------  ------------  --------------
 Share based payments                              -             -         424,570
--------------------------------------  ------------  ------------  --------------
 Operating income before working
--------------------------------------  ------------  ------------  --------------
 capital changes
--------------------------------------  ------------  ------------  --------------
 Change in trade and other
--------------------------------------  ------------  ------------  --------------
 receivables                                (55,568)       (8,015)        (29,984)
--------------------------------------  ------------  ------------  --------------
 Change in trade and other payables           61,078        86,777          19,722
--------------------------------------  ------------  ------------  --------------
 Write down of exploration costs                   -             -       2,442,897
--------------------------------------  ------------  ------------  --------------
 Cash generated from Group
--------------------------------------  ------------  ------------  --------------
 operations                                (251,888)     (345,464)       (914,954)
--------------------------------------  ------------  ------------  --------------
 Cash flows from investing activities
--------------------------------------  ------------  ------------  --------------
 Expenditure on exploration
--------------------------------------  ------------  ------------  --------------
 activities                                (537,506)     (257,609)       (330,385)
--------------------------------------  ------------  ------------  --------------
 Net cash used in investing
--------------------------------------  ------------  ------------  --------------
 activities                                (537,506)     (257,609)       (330,385)
--------------------------------------  ------------  ------------  --------------
 Cash flows from financing activities
--------------------------------------  ------------  ------------  --------------
 Proceeds from issue of share capital        712,500       749,957       1,753,815
--------------------------------------  ------------  ------------  --------------
 Investment Income                             2,372             -           7,249
--------------------------------------  ------------  ------------  --------------
 Net cash proceeds from financing
--------------------------------------  ------------  ------------  --------------
 activities                                  714,872       749,957       1,761,064
--------------------------------------  ------------  ------------  --------------
 Net increase in cash and cash
--------------------------------------  ------------  ------------  --------------
 equivalents                                (74,522)       146,884         515,725
--------------------------------------  ------------  ------------  --------------
 Cash and cash equivalents at
--------------------------------------  ------------  ------------  --------------
 beginning of period                         937,084       421,359         421,359
--------------------------------------  ------------  ------------  --------------
 Cash and cash equivalents at end
--------------------------------------  ------------  ------------  --------------
 of period                                   862,562       568,243         937,084
--------------------------------------  ------------  ------------  --------------
Notes to the unaudited condensed consolidated interim financial
statements
For the six months ended 31 March 2012
1. General information
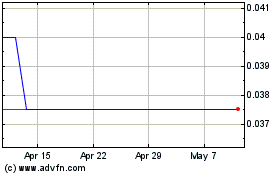
Kibo Energy (LSE:KIBO)
Historical Stock Chart
From Jun 2024 to Jul 2024

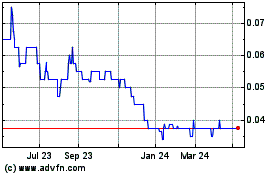
Kibo Energy (LSE:KIBO)
Historical Stock Chart
From Jul 2023 to Jul 2024
