James Hardie announces a fiscal year 2019
first half dividend of US10.0 cents per security
James Hardie today announced results for the second quarter of
fiscal year 2019 and the half year ended 30 September 2018:
- Group Adjusted net operating profit of
US$80.9 million for the quarter and US$160.8 million for the half
year, an increase of 7% and 17%, respectively, compared to the
prior corresponding periods (“pcp”);
- Group Adjusted EBIT of US$106.9 million
for the quarter and US$214.0 million for the half year, an increase
of 1% and 10%, respectively, compared to pcp;
- Group net sales of US$644.6 million for
the quarter and US$1,295.6 million for the half year, an increase
of 23% and 25%, respectively, compared to pcp;
- North America Fiber Cement Segment
volume increased 5% for the quarter and half year, compared to
pcp;
- North America Fiber Cement Segment EBIT
margin excluding product line discontinuation expenses of 22.8% for
the quarter and 23.8% for the half year;
- Asia Pacific Fiber Cement Segment EBIT
margin of 23.4% for the quarter and 23.8% for the half year;
- Europe Building Products Segment
Adjusted EBIT margin excluding costs associated with the
acquisition of 9.7% for the quarter and 10.9% for the half year;
and
- The Fermacell acquisition closed on 3
April 2018 and is included in the financial results for the first
half of fiscal year 2019.
CEO Commentary
James Hardie CEO Louis Gries said, “Our North America Fiber
Cement Segment delivered good top line growth of 9% for the quarter
and 10% for the half year, respectively. Volume increased 5%
for both the quarter and half year, with our exteriors business
continuing to grow modestly above our addressable market.
Additionally, EBIT margin excluding product line discontinuation
expenses of 22.8% and 23.8% for the quarter and half year,
respectively, remain within our target range, but continue to be
pressured by the increasing market costs of raw materials and
freight. We anticipate this inflationary pressure against our key
input costs will continue through the rest of the year.
Furthermore, while primary demand growth improved in the second
quarter, our focus remains on continuing to build momentum and
delivering a higher primary demand growth in fiscal year 2020.”
He continued, “Within our Asia Pacific Fiber Cement Segment, our
Australian and Philippines businesses achieved volume growth above
their underlying market growth. Furthermore, our Australian
business delivered a 10% and 13% increase in EBIT for the quarter
and half year, respectively, in local currency. However, the
segment results in US dollars for the quarter and half year were
unfavorably impacted by the change in foreign exchange rates.”
He added, “We closed our acquisition of Fermacell on 3 April
2018, and the new Europe Building Products Segment delivered strong
net sales compared to the prior corresponding periods, and an
Adjusted EBIT margin excluding costs associated with the
acquisition of 9.7% for the quarter and 10.9% for the half
year. We are encouraged by the early indicators from our
European business.”
Mr. Gries continued, “After a detailed review of our product
portfolio and business segments, we have determined the appropriate
path forward is to discontinue the Windows business and the
Multiple Contour Trim product line, and to simplify our core
ColorPlus product offering. These decisions will help focus us on
our core business, drive higher return on capital and accelerate
our focus on 35/90 in North America, €1 billion in 10 years in
Europe and continued growth in Asia Pacific.”
He concluded, “Our consolidated group results reflected overall
steady financial performance in a difficult input cost and foreign
exchange environment, and modest growth in our primary
markets.”
Outlook
We expect to see the modest growth in the US housing market to
continue in fiscal year 2019. The single family new construction
market and repair and remodel market are expected to grow similarly
to the year-on-year growth experienced in fiscal year 2018. The
Company expects new construction starts between approximately 1.2
and 1.3 million.
We expect our North America Fiber Cement segment EBIT margin to
be in the top half of our stated target range of 20% to 25% for
fiscal year 2019. This expectation is based upon the Company
continuing to achieve strong operating performance in its plants,
exchange rates at current levels and a continuation of current
inflationary trends for input costs.
Net sales from the Australian business are expected to trend
above the average growth of the domestic repair and remodel and
single family detached housing markets in the eastern states of
Australia.
Full Year Earnings
Guidance
Management notes the range of analysts’ forecasts for net
operating profit excluding asbestos for the year ending 31 March
2019 is between US$313 million and US$335 million. Management
expects full year Adjusted net operating profit to be between
US$280 million and US$320 million assuming, among other things,
housing conditions in the United States continue to improve in line
with our assumed forecast of new construction starts, input prices
remain consistent and an average USD/AUD exchange rate that is at,
or near current levels for the remainder of the year. Management
cautions that although US housing activity has been improving,
market conditions remain somewhat uncertain and some input costs
remain volatile.
The comparable Adjusted net operating profit for fiscal year
2018 was US$291.3 million. The Company is unable to forecast the
comparable US GAAP financial measure due to uncertainty regarding
the impact of actuarial estimates on asbestos-related assets and
liabilities in future periods.
Further Information
Readers are referred to the Company’s Condensed Consolidated
Financial Statements and Management’s Analysis of Results for the
second quarter and half year ended 30 September 2018 for additional
information regarding the Company’s results, including information
regarding income taxes, the asbestos liability and contingent
liabilities.
As of 30 June 2018, the Company changed its reportable operating
segments. Previously, the Company reported on four operating
segments: (i) North America Fiber Cement, (ii) International Fiber
Cement, (iii) Other Businesses, and (iv) Research and Development.
As of 30 June 2018, the Company began reporting on five operating
segments: (i) North America Fiber Cement, (ii) Asia Pacific Fiber
Cement, (iii) Europe Building Products, (iv) Other Businesses, and
(v) Research and Development. The significant changes to how
certain businesses are reported in the new segment structure are as
follows: (i) our European Fiber Cement business as well as the
newly acquired Fermacell business are now reported as the Europe
Building Products segment, and the remaining businesses that were
historically reported in the International Fiber Cement segment are
now reported in the Asia Pacific Fiber Cement segment. The Company
has revised its historical segment information at 31 March 2018 and
for the second quarter and half year ended 30 September 2017 to be
consistent with the new reportable segment structure. The change in
reportable segments had no effect on the Company's financial
position, results of operations or cash flows for the periods
presented. Readers are referred to Note 15 of our condensed
consolidated financial statements for further information on our
segments.
Use of Non-GAAP Financial Information;
Australian Equivalent Terminology
This Media Release includes financial measures that are not
considered a measure of financial performance under generally
accepted accounting principles in the United States (GAAP), such as
Adjusted net operating profit and Adjusted EBIT. These non-GAAP
financial measures should not be considered to be more meaningful
than the equivalent GAAP measure. Management has included such
measures to provide investors with an alternative method for
assessing its operating results in a manner that is focused on the
performance of its ongoing operations and excludes the impact of
certain legacy items, such as asbestos adjustments. Additionally,
management uses such non-GAAP financial measures for the same
purposes. However, these non-GAAP financial measures are not
prepared in accordance with US GAAP, may not be reported by all of
the Company’s competitors and may not be directly comparable to
similarly titled measures of the Company’s competitors due to
potential differences in the exact method of calculation. For
additional information regarding the non-GAAP financial measures
presented in this Media Release, including a reconciliation of each
non-GAAP financial measure to the equivalent US GAAP measure, see
the section titled “Non-US GAAP Financial Measures” included in the
Company’s Management’s Analysis of Results for the second quarter
and half year ended 30 September 2018.
In addition, this Media Release includes financial measures and
descriptions that are considered to not be in accordance with US
GAAP, but which are consistent with financial measures reported by
Australian companies, such as operating profit, EBIT and EBIT
margin. Since the Company prepares its Consolidated Financial
Statements in accordance with US GAAP, the Company provides
investors with a table and definitions presenting cross-references
between each US GAAP financial measure used in the Company’s
Consolidated Financial Statements to the equivalent non-US GAAP
financial measure used in this press release. See the sections
titled “Non-US GAAP Financial Measures” included in the Company’s
Management’s Analysis of Results for the second quarter and half
year ended 30 September 2018.
Forward-Looking
Statements
This Media Release contains forward-looking statements and
information that are necessarily subject to risks, uncertainties
and assumptions. Many factors could cause the actual results,
performance or achievements of James Hardie to be materially
different from those expressed or implied in this release,
including, among others, the risks and uncertainties set forth in
Section 3 “Risk Factors” in James Hardie’s Annual Report on
Form 20-F for the year ended 31 March 2018; changes in general
economic, political, governmental and business conditions globally
and in the countries in which James Hardie does business; changes
in interest rates, changes in inflation rates; changes in exchange
rates; the level of construction generally; changes in cement
demand and prices; changes in raw material and energy prices;
changes in business strategy and various other factors. Should one
or more of these risks or uncertainties materialize, or should
underlying assumptions prove incorrect, actual results may vary
materially from those described herein. James Hardie assumes no
obligation to update or correct the information contained in this
Media Release except as required by law.
View source
version on businesswire.com: https://www.businesswire.com/news/home/20181107005980/en/
Media/Analyst Enquiries:James HardieJason Miele, +61 2
8845 3352Vice President, Investor and Media
Relationsmedia@jameshardie.com.au
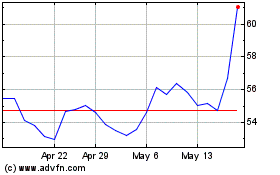
James Hardie Industries (ASX:JHX)
Historical Stock Chart
From Dec 2024 to Jan 2025

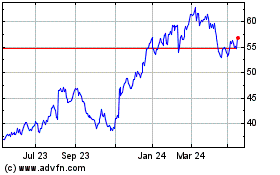
James Hardie Industries (ASX:JHX)
Historical Stock Chart
From Jan 2024 to Jan 2025
