Delivers All-time Group Quarterly Record
Results for Net Sales, Adjusted EBIT, Adjusted EBIT Margin,
Adjusted NOPAT and Operating Cash Flow
Adjusted NOPAT +22% to US$120.5 Million for
the Second Quarter Fiscal Year 2021
Operating Cash Flow Rises +66% to US$416.8
Million for the First Half Fiscal Year 2021
Annual Ordinary Dividend Reinstated for
Fiscal Year 2021
Reaffirms Fiscal Year 2021 Adjusted NOPAT
Guidance Range of US$380 Million to US$420 Million
Fiscal Year Second Quarter 2021 Highlights, Compared to
Fiscal Year Second Quarter 2020 As Applicable:
- Group Net Sales of US$736.8 million, +12% growth
- Group Adjusted EBIT of US$163.1 million, +22% growth
- Group Adjusted EBIT margin of 22.1%, an improvement of 180
bps
- North America Fiber Cement Segment Net Sales +12% and Adjusted
EBIT +19% in US Dollars, with Adjusted EBIT margin up 180 basis
points to 28.9%
- North America Fiber Cement Segment exteriors volume +11%
- Europe Building Products Segment Net Sales +8% and Adjusted
EBIT +81% in Euros, with Adjusted EBIT margin up 450 basis points
to 11.1%
- Asia Pacific Fiber Cement Segment Net Sales +4% and Adjusted
EBIT +37% in Australian Dollars, with Adjusted EBIT margin up 770
basis points to 31.7%
- Reduce gross debt by US$400 million by the end of fiscal year
2021
- Reinstate an annual ordinary dividend for fiscal year 2021
supported by strong cash generation
James Hardie Industries plc (ASX: JHX; NYSE: JHX), the
world’s #1 producer and marketer of high-performance fiber cement
and fiber gypsum building solutions announced its second quarter
and first half fiscal year 2021 results, for the periods ending 30
September 2020.
Record quarterly group net sales of US$736.8 million increased
12% year-over-year. Group Adjusted EBIT margin improved 180 basis
points to 22.1%, with all three operating regions (North America,
Asia Pacific, and Europe) delivering stronger financial
results.
James Hardie CEO, Dr. Jack Truong, said, “Delivering these
record results is a confirmation that the global strategy we
launched in early calendar 2019 to transform James Hardie into a
high-performing, world-class organization is on track and is
accelerating. This is now the sixth consecutive quarter that our
team has delivered growth above market with strong returns.”
Strong cash flow generation of US$416.8 million in the first
half was driven by continuous improvement in the Company’s LEAN
manufacturing performance, strong profitable sales growth and the
integration of its supply chain with its customers. The Company has
achieved global LEAN savings of US$62.0 million over the 18-month
period since inception of LEAN. Working capital improved by
US$101.5 million during the first half of fiscal year 2021.
Dr. Truong continued, “Our confidence in the global business and
its resiliency to various market conditions continues to evolve. We
expect to continue to invest strategically to unlock future organic
growth, including the development and commercialization of
consumer-focused innovations. These increased investments will
include capacity expansion to meet growing demand for our products
supported by aggressive marketing and brand building efforts as we
seek to gain incremental share in all key markets in the coming
years.”
The Company announced plans to reduce gross debt by US$400
million by the end of fiscal year 2021 and to reinstate an annual
ordinary dividend for fiscal year 2021 with more details to be
announced in May 2021.
“We continue to successfully navigate through this complex
global pandemic, executing effectively on our strategic actions
that were implemented at the start of the crisis. Our relentless
commitment to servicing our customers resulted in record operating
cash flow in the first half of fiscal year 2021. I am pleased to
announce today that the step changes that we have made to improve
our financial results and cash performance put us in a position to
further strengthen our balance sheet and resume returning capital
to our shareholders,” concluded Dr. Truong.
Outlook and Earnings
Guidance
James Hardie continues to assess the impacts and the
uncertainties of the COVID-19 pandemic on the geographic locations
in which we operate, as well as its impact on the new construction
and repair and remodel building markets. The COVID-19 pandemic
remains highly volatile and continues to evolve, and the full
impact of the pandemic on the Company’s business and future
financial performance remains uncertain.
The Company is reaffirming its recently provided outlook for
fiscal year 2021, ending March 31, 2021. Management expects fiscal
year 2021 Adjusted net operating profit to be between US$380
million and US$420 million. The comparable Adjusted net operating
profit for fiscal year 2020 was US$352.8 million. James Hardie’s
guidance is based on current estimates and assumptions and is
subject to several known and unknown uncertainties and risks,
including those related to the COVID-19 pandemic.
Key Financial
Information
Q2 FY21
Q2 FY20
Change
1H FY21
1H FY20
Change
Group
(US$ millions) Net Sales
$
736.8
$
660.1
12%
$
1,363.1
$
1,316.9
4%
Adjusted EBIT
163.1
134.2
22%
288.0
258.6
11%
Adjusted EBIT Margin
22.1%
20.3%
1.8 pts
21.1%
19.6%
1.5 pts
Adjusted net operating profit
120.5
98.6
22%
209.8
188.8
11%
Operating Cash Flow
227.6
111.6
104%
416.8
251.8
66%
North
America Fiber Cement (US$ millions) Net Sales
$
515.0
$
459.6
12%
$
966.8
$
911.9
6%
Adjusted EBIT
148.6
124.7
19%
279.5
238.2
17%
Adjusted EBIT Margin
28.9%
27.1%
1.8 pts
28.9%
26.1%
2.8 pts
Asia
Pacific Fiber Cement (A$ millions) Net Sales
A$ 170.6
A$ 164.2
4%
A$ 309.3
A$ 318.6
(3%)
Adjusted EBIT
54.1
39.5
37%
87.7
74.9
17%
Adjusted EBIT Margin
31.7%
24.0%
7.7 pts
28.6%
23.5%
5.1 pts
Europe
Building Products (€ millions) Net Sales
€
85.3
€
79.0
8%
€
160.7
€
164.4
(2%)
Adjusted EBIT
9.4
5.2
81%
11.4
12.3
(7%)
Adjusted EBIT Margin
11.1%
6.6%
4.5 pts
7.4%
7.5%
(0.1 pts)
Further Information
Readers are referred to the Company’s Condensed Consolidated
Financial Statements and Management’s Analysis of Results for the
six months ended 30 September 2020 for additional information
regarding the Company’s results, including information regarding
income taxes, the asbestos liability and contingent
liabilities.
Management Briefing for Analysts,
Investors and Media
James Hardie will conduct a teleconference and audio webcast for
analysts, investors and media at 9:00am (AEDT) / 5:00pm (EDT)
today. Analysts, investors and media can access the management
briefing via the following:
- Live Webcast:
https://ir.jameshardie.com.au/jh/results_briefings.jsp
- Live Teleconference Registration:
https://s1.c-conf.com/diamondpass/10010586-ueislz.html All
participants wishing to join the teleconference will need to
pre-register by navigating to
https://s1.c-conf.com/diamondpass/10010586-ueislz.html Once
registered, you will receive a calendar invite with dial-in numbers
and a unique PIN which will be required to join the call.
- Webcast Replay: Will be available two hours after the Live
Webcast concludes at
https://ir.jameshardie.com.au/jh/results_briefings.jsp
Use of Non-GAAP Financial Information;
Australian Equivalent Terminology
This Media Release includes financial measures that are not
considered a measure of financial performance under generally
accepted accounting principles in the United States (GAAP), such as
Adjusted net operating profit and Adjusted EBIT. These non-GAAP
financial measures should not be considered to be more meaningful
than the equivalent GAAP measure. Management has included such
measures to provide investors with an alternative method for
assessing its operating results in a manner that is focused on the
performance of its ongoing operations and excludes the impact of
certain legacy items, such as asbestos adjustments. Additionally,
management uses such non-GAAP financial measures for the same
purposes. However, these non-GAAP financial measures are not
prepared in accordance with US GAAP, may not be reported by all of
the Company’s competitors and may not be directly comparable to
similarly titled measures of the Company’s competitors due to
potential differences in the exact method of calculation. The
Company is unable to forecast the comparable US GAAP financial
measure for future periods due to, amongst other factors,
uncertainty regarding the impact of actuarial estimates on
asbestos-related assets and liabilities in future periods. For
additional information regarding the non-GAAP financial measures
presented in this Media Release, including a reconciliation of each
non-GAAP financial measure to the equivalent US GAAP measure, see
the section titled “Non-US GAAP Financial Measures” included in the
Company’s Management’s Analysis of Results for the second quarter
ended 30 September 2020.
In addition, this Media Release includes financial measures and
descriptions that are considered to not be in accordance with US
GAAP, but which are consistent with financial measures reported by
Australian companies, such as operating profit, EBIT and EBIT
margin. Since the Company prepares its Consolidated Financial
Statements in accordance with US GAAP, the Company provides
investors with a table and definitions presenting cross-references
between each US GAAP financial measure used in the Company’s
Consolidated Financial Statements to the equivalent non-US GAAP
financial measure used in this Media Release. See the sections
titled “Non-US GAAP Financial Measures” included in the Company’s
Management’s Analysis of Results for the second quarter ended 30
September 2020.
Forward-Looking
Statements
This Media Release contains forward-looking statements and
information that are necessarily subject to risks, uncertainties
and assumptions. Many factors could cause the actual results,
performance or achievements of James Hardie to be materially
different from those expressed or implied in this release,
including, among others, the risks and uncertainties set forth in
Section 3 “Risk Factors” in James Hardie’s Annual Report on Form
20-F for the year ended 31 March 2020; changes in general economic,
political, governmental and business conditions globally and in the
countries in which James Hardie does business; changes in interest
rates; changes in inflation rates; changes in exchange rates; the
level of construction generally; changes in cement demand and
prices; changes in raw material and energy prices; changes in
business strategy and various other factors. Should one or more of
these risks or uncertainties materialize, or should underlying
assumptions prove incorrect, actual results may vary materially
from those described herein. James Hardie assumes no obligation to
update or correct the information contained in this Media Release
except as required by law.
This media release has been authorized by the James Hardie Board
of Directors.
END
James Hardie Industries plc is a limited liability company
incorporated in Ireland with its registered office at Europa House,
2nd Floor, Harcourt Centre, Harcourt Street, Dublin 2, D02 WR20,
Ireland
View source
version on businesswire.com: https://www.businesswire.com/news/home/20201109006193/en/
Investor/Media/Analyst Enquiries: Anna Collins
Telephone: +61 2 8845 3356 Email:
media@jameshardie.com.au
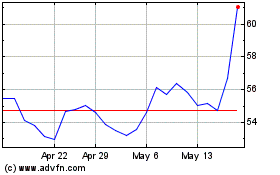
James Hardie Industries (ASX:JHX)
Historical Stock Chart
From Dec 2024 to Jan 2025

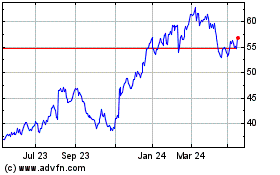
James Hardie Industries (ASX:JHX)
Historical Stock Chart
From Jan 2024 to Jan 2025
