BNB Price Surge: Upbeat Momentum Builds After $724 Breakout
December 04 2024 - 11:30AM
NEWSBTC
BNB has taken the spotlight with a powerful surge, breaking past
the critical $724 resistance level and signaling the potential for
more growth. This breakout has ignited bullish momentum, sparking
speculation that the token could be gearing up for uncharted
territory. With strong market sentiment and increasing trading
activity, BNB appears poised to extend its rally, leaving many
wondering how high it can climb in the days ahead. This article
aims to explore BNB’s recent breakout above the $724 level, delving
into the key drivers behind its bullish strength. it seeks to
assess whether the asset can sustain its upward trajectory and set
new all-time highs by analyzing technical indicators, market
sentiment, and potential resistance zones BNB Breaks $724: A
Key Milestone For The Bulls On the 4-hour chart, BNB is positioned
above the 100-day Simple Moving Average (SMA), a key indicator of
its current bullish trajectory. Significantly, this alignment
highlights the token’s underlying strength and suggests that
positive sentiment is driving its momentum. The steady upward
movement reflects growing optimism among traders, with BNB now
aiming to create new highs. An examination of the 4-hour Relative
Strength Index (RSI) reveals a notable climb, with the indicator
reaching the 78% threshold after rebounding from a recent low of
46%. The sharp increase underscores a strong surge in bullish
momentum, as intensified buying pressure has driven the RSI into
overbought territory, thereby signaling a significant change in
market sentiment. Related Reading: BNB Surges 18% To Hit Record
High Close To $800: Is Further Growth On The Horizon? Also, the
daily chart further emphasizes BNB’s strong upward momentum, marked
by the formation of bullish candlesticks as the price climbs above
$724, indicating the possibility of continued gains and an
extension of the rally. Its position above the SMA reinforces the
positive trend, demonstrating sustained strength and market
confidence, setting the stage for a continued rally. Lastly, the
daily chart’s RSI recently reached 76%, indicating that BNB has
entered overbought territory. This suggests a strong optimistic
sentiment as substantial buying pressure drives prices higher.
While this level points to the potential for more upside, it also
signals that the asset may be overheating. Can The Bulls Sustain
The Momentum Beyond $724? BNB has surged past the crucial $724
level, fueling a strong bullish movement. The critical question is
whether the bulls can maintain this upward trajectory and bolster
its value. If the buying pressure remains strong, the asset could
be on track to reach new highs, with $800 emerging as the next key
target. Related Reading: BNB Price Poised for Fresh Increase: Will
Momentum Build? However, if the cryptocurrency fails to maintain
its upbeat momentum, it could begin to decline toward the $724
level. A breach below this support may spark additional downside
movement, possibly leading the price to test other support zones.
Featured image from Binance, chart from Tradingview.com
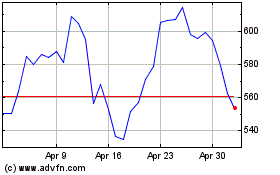
Binance Coin (COIN:BNBUSD)
Historical Stock Chart
From Dec 2024 to Jan 2025

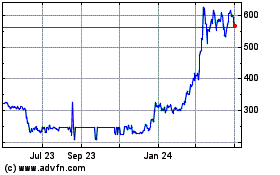
Binance Coin (COIN:BNBUSD)
Historical Stock Chart
From Jan 2024 to Jan 2025
