XRP Nears Oversold Territory: Will $1.9 Support Trigger A Rebound?
December 31 2024 - 5:00AM
NEWSBTC
XRP has reached a critical $1.9 support level, a price point that
could define its short-term trajectory. At the same time, the
Composite Trend Oscillator indicator is signaling oversold
conditions, hinting at the possibility of a price rebound. Oversold
readings typically suggest that selling pressure may have peaked,
paving the way for buyers to regain control. The spotlight is now
on the $1.9 support level—will it act as a launchpad for a bullish
reversal, or will bears push XRP into deeper declines? As the
market watches closely, this combination of technical signals and
price action could set the stage for XRP’s next major move. $1.9
Support Role In XRP Price Action The $1.9 support level has emerged
as a pivotal zone for XRP, acting as a foundation for its price
stability amid ongoing market turbulence. Support levels are
essential in technical analysis, serving as points where buying
pressure is typically strong enough to halt or reverse a downtrend.
For XRP, the $1.9 level represents a psychological threshold and
holds significant historical importance in its price action.
Related Reading: XRP Price Momentum Stalls: Bulls Fails to Break
Through Additionally, this level has been tested multiple times in
the past, demonstrating its resilience as a reliable anchor for
bullish recoveries. Traders and investors often view such critical
support zones as opportunities for entry, anticipating a possible
bounce that might lead to upward momentum. However, its role
extends beyond just being a price floor. It also serves as an
indicator of market sentiment and the balance of power between
bulls and bears. Currently, as XRP approaches this key level, the
question remains whether it can sustain the buying interest needed
to spark a recovery. A successful defense of the $1.9 support would
reaffirm its strength and likely attract fresh buying pressure,
setting the stage for a rally toward higher resistance levels.
However, a breach of this critical support could signal a shift in
momentum, leading to more declines and triggering stop-loss orders
from traders, which may accelerate the downward move. The Bigger
Picture: What Current Setup Means For Its Future XRP’s current
technical setup offers crucial insights into its next potential
direction. The $1.9 support level is a key zone, with oversold
signals suggesting a rebound. If this support level holds, it is
likely to restore bullish confidence, sparking an upward movement
toward the $2.9 resistance level and beyond. Related Reading: XRP
Price Crash: Analyst Says Don’t Get Distracted As RSI Is Still
Above A Bullish 50% However, if this level fails to hold, it could
trigger additional bearish momentum, pushing the price toward the
next lower support zone at $1.7. XRP breaking below this level
could lead to a retest of additional support levels. Featured image
from Medium, chart from Tradingview.com
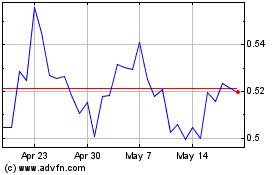
Ripple (COIN:XRPUSD)
Historical Stock Chart
From Dec 2024 to Jan 2025

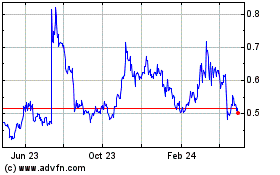
Ripple (COIN:XRPUSD)
Historical Stock Chart
From Jan 2024 to Jan 2025
