FTSE 350 Precious Metals... Key Figures
|
FTSE 350 Precious Metals... Balance Sheet| %1$s Balance Sheet | | Sorry No Data Available |
|
 Share Price Performance| Share Price Performance | | Sample Period † | High | Low | | 1 week | 12,536.83 | 11,652.31 |
| 4 weeks | 12,536.83 | 10,409.30 |
| 12 weeks | 12,536.83 | 9,928.52 |
| 1 year | 13,143.56 | 7,554.16 |
Share Price Chart (5 years)| Share Price Chart (5 years) | 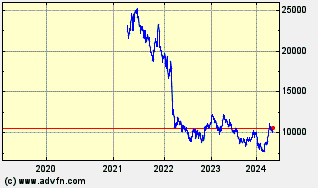 |
|
FTSE 350 Precious Metals... Historic Returns| %1$s Historic Returns | | Giorni da oggi † | Open | Change | % | Open Avg. | Avg. Daily Vol [m] | Total Vol [m] | VWAP | | 1 week | 11,768.07 | 442.48 | 3.76 | 11,652.31 | - | | - |
| 4 weeks | 10,915.49 | 1,295.06 | 11.86 | 10,409.30 | - | | - |
| 12 weeks | 10,934.82 | 1,275.73 | 11.67 | 9,928.52 | - | | - |
| 26 weeks | 9,923.15 | 2,287.40 | 23.05 | 9,519.83 | - | | - |
| 1 year | 7,764.94 | 4,445.61 | 57.25 | 7,554.16 | - | | - |
| 3 years | 17,501.75 | -5,291.20 | -30.23 | 7,554.16 | - | | - |
| 5 years | 113.21 | 12,097.34 | 10,685.75 | 113.21 | - | | - |
| † periods calculated are whole weeks rather than calendar months | |
|
