Pay vs Performance Disclosure - USD ($)
|
12 Months Ended |
Oct. 29, 2023 |
Oct. 30, 2022 |
Oct. 31, 2021 |
| Pay vs Performance Disclosure |
|
|
|
| Pay vs Performance Disclosure, Table |
PAY VERSUS PERFORMANCE The following tables and related disclosure has been prepared in accordance with the SEC’s pay versus performance rules in Item 402(v) of Regulation S-K and do not reflect compensation actually earned, realized or received by the NEOs. The Compensation Committee did not consider this pay versus performance disclosure in making its pay decisions for any of the years shown. For a discussion of how the Compensation Committee seeks to align pay with performance when setting NEO compensation, see “ Compensation Discussion and Analysis” above beginning on page 29. 2023 | | | $161,826,161 | | | $767,654,487 | | | $26,807,158 | | | $119,860,261 | | | $261.58 | | | $131.38 | | | $14,082 | | | $35,819 | 2022 | | | 60,606,971 | | | 49,890,953 | | | 4,444,960 | | | (11,048,223) | | | 143.70 | | | 106.05 | | | 11,495 | | | 33,203 | 2021 | | | 60,703,627 | | | 84,077,321 | | | 14,983,358 | | | 42,183,932 | | | 156.83 | | | 144.43 | | | 6,736 | | | 27,450 |
(1)
| Hock E. Tan was our PEO for each year presented. The individuals comprising the Non-PEO NEOs for each year presented are listed below. |
Kristen M. Spears | | | Kristen M. Spears | | | Kristen M. Spears | Mark D. Brazeal | | | Mark D. Brazeal | | | Mark D. Brazeal | Charlie B. Kawwas, Ph.D. | | | Charlie B. Kawwas, Ph.D. | | | Charlie B. Kawwas, Ph.D. | | | | Thomas H. Krause, Jr. | | | Thomas H. Krause, Jr. |
(2)
| The amounts in this column are the amounts reported in the “Total” column of the “Fiscal 2023 Summary Compensation Table” for the listed fiscal years for our PEO. |
(3)
| The amounts in this column represent the amount of CAP to our PEO as calculated in accordance with Item 402(v) of Regulation S-K and reflect the following adjustments made to the SCT total compensation for our PEO for each year to determine CAP. |
2023 | | | $161,826,161 | | | $(160,540,000) | | | $591,790,000 | | | $79,438,766 | | | $— | | | $95,139,560 | | | $767,654,487 | 2022 | | | 60,606,971 | | | (53,913,448) | | | 40,333,831 | | | (6,091,708) | | | 8,955,307 | | | — | | | 49,890,953 | 2021 | | | 60,703,627 | | | (54,056,808) | | | 61,353,932 | | | — | | | — | | | 16,076,570 | | | 84,077,321 |
(a)
| Equity values are the amounts reported in the “Stock Awards” column of the “Fiscal 2023 Summary Compensation Table,” calculated in accordance with ASC 718. |
(4)
| The amounts in this column are the average amounts reported in the “Total” column of the “Fiscal 2023 Summary Compensation Table” for the listed fiscal years (or the “Fiscal Year 2022 Summary Compensation Table” in our Proxy Statement filed with the SEC on February 17, 2023 for Mr. Krause) for our Non-PEO NEOs. |
(5)
| The amounts in this column represent the average amount of CAP to the Non-PEO NEOs as calculated in accordance with Item 402(v) of Regulation S-K and reflect the following adjustments made to the average SCT total compensation for the Non-PEO NEOs for each year to determine the CAP. |
2023 | | | $26,807,158 | | | $(25,594,033) | | | $73,237,174 | | | $35,100,917 | | | $10,309,045 | | | $— | | | $119,860,261 | 2022 | | | 4,444,960 | | | (3,118,630) | | | 2,133,722 | | | (3,757,512) | | | 2,071,401 | | | (12,822,164) | | | (11,048,223) | 2021 | | | 14,983,358 | | | (13,420,285) | | | 16,065,386 | | | 19,949,490 | | | 4,605,983 | | | — | | | 42,183,932 |
(a)
| Equity values are the amounts reported in the “Stock Awards” column of the “Fiscal 2023 Summary Compensation Table” (or the “Fiscal Year 2022 Summary Compensation Table” in our Proxy Statement filed with the SEC on February 17, 2023 for Mr. Krause), calculated in accordance with ASC 718. |
(6)
| The NASDAQ 100 Index is the industry peer group we used for the purposes of the stock performance graph required by Item 201(e) of Regulation S-K included in our 2023 Annual Report. This table assumes $100 was invested in Broadcom and in the NASDAQ 100 Index, respectively, for the period starting October 30, 2020 through the end of the listed year. Historical stock performance is not necessarily indicative of future stock performance. The compensation peer group referenced by the Compensation Committee for purposes of determining executive compensation is discussed under “Compensation Discussion and Analysis — Compensation Competitive Analysis.” |
(7)
| As discussed under “Compensation Discussion and Analysis — Elements of Fiscal 2023 Executive Compensation Program — Annual Cash Incentive Bonus Plan” above, net revenue is one of the corporate financial goals used to determine the APB Plan payout, which we determined to be the most important financial performance measure used to link Broadcom performance to CAP to our PEO and Non-PEO NEOs in fiscal 2023. Therefore, net revenue is designated as our Company Selected Measure for fiscal 2023. This performance measure may not have been the most important financial performance measure for fiscal 2022 and 2021 and we may determine a different financial performance measure to be the most important financial performance measure in future years. |
|
|
|
| Company Selected Measure Name |
net revenue
|
|
|
| Named Executive Officers, Footnote |
(1)
| Hock E. Tan was our PEO for each year presented. The individuals comprising the Non-PEO NEOs for each year presented are listed below. |
Kristen M. Spears | | | Kristen M. Spears | | | Kristen M. Spears | Mark D. Brazeal | | | Mark D. Brazeal | | | Mark D. Brazeal | Charlie B. Kawwas, Ph.D. | | | Charlie B. Kawwas, Ph.D. | | | Charlie B. Kawwas, Ph.D. | | | | Thomas H. Krause, Jr. | | | Thomas H. Krause, Jr. |
|
|
|
| Peer Group Issuers, Footnote |
(6)
| The NASDAQ 100 Index is the industry peer group we used for the purposes of the stock performance graph required by Item 201(e) of Regulation S-K included in our 2023 Annual Report. This table assumes $100 was invested in Broadcom and in the NASDAQ 100 Index, respectively, for the period starting October 30, 2020 through the end of the listed year. Historical stock performance is not necessarily indicative of future stock performance. The compensation peer group referenced by the Compensation Committee for purposes of determining executive compensation is discussed under “Compensation Discussion and Analysis — Compensation Competitive Analysis.” |
|
|
|
| PEO Total Compensation Amount |
$ 161,826,161
|
$ 60,606,971
|
$ 60,703,627
|
| PEO Actually Paid Compensation Amount |
$ 767,654,487
|
49,890,953
|
84,077,321
|
| Adjustment To PEO Compensation, Footnote |
(3)
| The amounts in this column represent the amount of CAP to our PEO as calculated in accordance with Item 402(v) of Regulation S-K and reflect the following adjustments made to the SCT total compensation for our PEO for each year to determine CAP. |
2023 | | | $161,826,161 | | | $(160,540,000) | | | $591,790,000 | | | $79,438,766 | | | $— | | | $95,139,560 | | | $767,654,487 | 2022 | | | 60,606,971 | | | (53,913,448) | | | 40,333,831 | | | (6,091,708) | | | 8,955,307 | | | — | | | 49,890,953 | 2021 | | | 60,703,627 | | | (54,056,808) | | | 61,353,932 | | | — | | | — | | | 16,076,570 | | | 84,077,321 |
(a)
| Equity values are the amounts reported in the “Stock Awards” column of the “Fiscal 2023 Summary Compensation Table,” calculated in accordance with ASC 718. |
|
|
|
| Non-PEO NEO Average Total Compensation Amount |
$ 26,807,158
|
4,444,960
|
14,983,358
|
| Non-PEO NEO Average Compensation Actually Paid Amount |
$ 119,860,261
|
(11,048,223)
|
42,183,932
|
| Adjustment to Non-PEO NEO Compensation Footnote |
(5)
| The amounts in this column represent the average amount of CAP to the Non-PEO NEOs as calculated in accordance with Item 402(v) of Regulation S-K and reflect the following adjustments made to the average SCT total compensation for the Non-PEO NEOs for each year to determine the CAP. |
2023 | | | $26,807,158 | | | $(25,594,033) | | | $73,237,174 | | | $35,100,917 | | | $10,309,045 | | | $— | | | $119,860,261 | 2022 | | | 4,444,960 | | | (3,118,630) | | | 2,133,722 | | | (3,757,512) | | | 2,071,401 | | | (12,822,164) | | | (11,048,223) | 2021 | | | 14,983,358 | | | (13,420,285) | | | 16,065,386 | | | 19,949,490 | | | 4,605,983 | | | — | | | 42,183,932 |
(a)
| Equity values are the amounts reported in the “Stock Awards” column of the “Fiscal 2023 Summary Compensation Table” (or the “Fiscal Year 2022 Summary Compensation Table” in our Proxy Statement filed with the SEC on February 17, 2023 for Mr. Krause), calculated in accordance with ASC 718. |
|
|
|
| Compensation Actually Paid vs. Total Shareholder Return |
RELATIONSHIP BETWEEN CAP AND FINANCIAL PERFORMANCE The following charts illustrate the relationship between CAP to our PEO and the average of CAP to our Non-PEO NEOs, and our cumulative TSR, net income and net revenue over the three most recently completed fiscal years. 
|
|
|
| Compensation Actually Paid vs. Net Income |
RELATIONSHIP BETWEEN CAP AND FINANCIAL PERFORMANCE The following charts illustrate the relationship between CAP to our PEO and the average of CAP to our Non-PEO NEOs, and our cumulative TSR, net income and net revenue over the three most recently completed fiscal years. 
|
|
|
| Compensation Actually Paid vs. Company Selected Measure |
RELATIONSHIP BETWEEN CAP AND FINANCIAL PERFORMANCE The following charts illustrate the relationship between CAP to our PEO and the average of CAP to our Non-PEO NEOs, and our cumulative TSR, net income and net revenue over the three most recently completed fiscal years. 
|
|
|
| Total Shareholder Return Vs Peer Group |
RELATIONSHIP BETWEEN OUR TSR AND INDUSTRY PEER GROUP TSR The following chart compares our cumulative TSR over the three most recently completed fiscal years to that of the NASDAQ 100 Index over the same period. 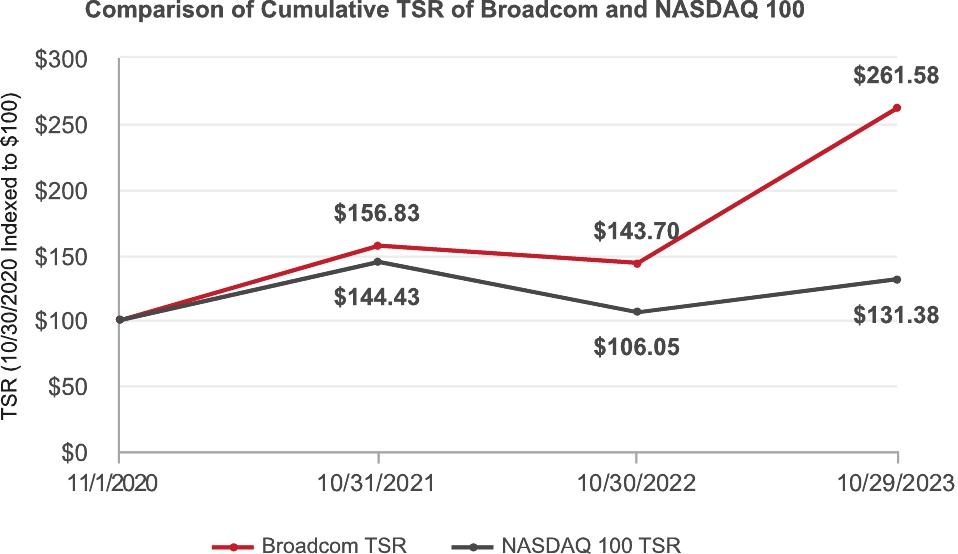
|
|
|
| Tabular List, Table |
TABULAR LIST OF MOST IMPORTANT FINANCIAL PERFORMANCE MEASURES The following table presents the financial performance measures that Broadcom considers to have been the most important in linking CAP to our PEO and other NEOs to Broadcom’s performance for fiscal 2023. The measures in this table are not ranked. Net Revenue
Adjusted Operating Margin
Divisional Expense Metric
Individual Performance Modifier |
|
|
|
| Total Shareholder Return Amount |
$ 261.58
|
143.7
|
156.83
|
| Peer Group Total Shareholder Return Amount |
131.38
|
106.05
|
144.43
|
| Net Income (Loss) |
$ 14,082,000,000
|
$ 11,495,000,000
|
$ 6,736,000,000
|
| Company Selected Measure Amount |
35,819,000,000
|
33,203,000,000
|
27,450,000,000
|
| PEO Name |
Hock E. Tan
|
Hock E. Tan
|
Hock E. Tan
|
| Measure:: 1 |
|
|
|
| Pay vs Performance Disclosure |
|
|
|
| Name |
Net Revenue
|
|
|
| Measure:: 2 |
|
|
|
| Pay vs Performance Disclosure |
|
|
|
| Name |
Adjusted Operating Margin
|
|
|
| Measure:: 3 |
|
|
|
| Pay vs Performance Disclosure |
|
|
|
| Name |
Divisional Expense Metric
|
|
|
| Measure:: 4 |
|
|
|
| Pay vs Performance Disclosure |
|
|
|
| Name |
Individual Performance Modifier
|
|
|
| PEO | Value of Stock Awards in SCT [Member] |
|
|
|
| Pay vs Performance Disclosure |
|
|
|
| Adjustment to Compensation, Amount |
$ (160,540,000)
|
$ (53,913,448)
|
$ (54,056,808)
|
| PEO | Year End Fair Value of Unvested Awards Granted in Covered Year [Member] |
|
|
|
| Pay vs Performance Disclosure |
|
|
|
| Adjustment to Compensation, Amount |
591,790,000
|
40,333,831
|
61,353,932
|
| PEO | Year Over Year Change in Fair Value of Unvested Awards from Prior Years [Member] |
|
|
|
| Pay vs Performance Disclosure |
|
|
|
| Adjustment to Compensation, Amount |
79,438,766
|
(6,091,708)
|
0
|
| PEO | Vesting Date Fair Value for Awards Granted and Vested in the Covered Year [Member] |
|
|
|
| Pay vs Performance Disclosure |
|
|
|
| Adjustment to Compensation, Amount |
0
|
8,955,307
|
0
|
| PEO | Change in Fair Value of Awards from Prior Years that Vested in Covered Year [Member] |
|
|
|
| Pay vs Performance Disclosure |
|
|
|
| Adjustment to Compensation, Amount |
95,139,560
|
0
|
16,076,570
|
| Non-PEO NEO | Value of Stock Awards in SCT [Member] |
|
|
|
| Pay vs Performance Disclosure |
|
|
|
| Adjustment to Compensation, Amount |
(25,594,033)
|
(3,118,630)
|
(13,420,285)
|
| Non-PEO NEO | Year End Fair Value of Unvested Awards Granted in Covered Year [Member] |
|
|
|
| Pay vs Performance Disclosure |
|
|
|
| Adjustment to Compensation, Amount |
73,237,174
|
2,133,722
|
16,065,386
|
| Non-PEO NEO | Year Over Year Change in Fair Value of Unvested Awards from Prior Years [Member] |
|
|
|
| Pay vs Performance Disclosure |
|
|
|
| Adjustment to Compensation, Amount |
35,100,917
|
(3,757,512)
|
19,949,490
|
| Non-PEO NEO | Change in Fair Value of Awards from Prior Years that Vested in Covered Year [Member] |
|
|
|
| Pay vs Performance Disclosure |
|
|
|
| Adjustment to Compensation, Amount |
10,309,045
|
2,071,401
|
4,605,983
|
| Non-PEO NEO | Prior Year End Fair Value of Awards from Prior Years Forfeited in Covered Year [Member] |
|
|
|
| Pay vs Performance Disclosure |
|
|
|
| Adjustment to Compensation, Amount |
$ 0
|
$ (12,822,164)
|
$ 0
|