Form DEFA14A - Additional definitive proxy soliciting materials and Rule 14(a)(12) material
January 11 2024 - 7:12AM
Edgar (US Regulatory)
UNITED STATES
SECURITIES AND EXCHANGE COMMISSION
Washington, D.C. 20549
SCHEDULE 14A
Proxy Statement Pursuant to Section 14(a)
of the
Securities Exchange Act of 1934
(Amendment No.)
Filed by the Registrant x
Filed by a Party other than the Registrant ¨
Check the appropriate box:
¨
Preliminary Proxy Statement
¨
Confidential, for Use of the Commission Only (as permitted by Rule 14a-6(e)(2))
¨
Definitive Proxy Statement
x
Definitive Additional Materials
¨
Soliciting Material Pursuant to Rule 14a-12
Consolidated
Communications Holdings, Inc.
(Name of Registrant
as Specified In Its Charter)
(Name of Person(s)
Filing Proxy Statement if Other Than the Registrant)
Payment of Filing Fee (Check the appropriate box)
| x | No fee required. |
| ¨ | Fee paid previously with preliminary materials. |
| ¨ | Fee computed on table in exhibit required by Item 25(b) per
Exchange Act Rules 14a6(i)(1) and 0-11. |
| Transaction with Searchlight is
the Best Strategic Alternative Available to Shareholders
Consolidated Communications Holdings, Inc.
January 10, 2024 |
| 2
Legal Disclosure
Forward-Looking Statements
Certain statements in this communication are forward-looking statements and are made pursuant to the safe harbor provisions of the Private Securities Litigation Reform Act of 1995. These forward-looking statements reflect, among other things, the
Company’s current expectations, plans, strategies and anticipated financial results.
There are a number of risks, uncertainties and conditions that may cause the Company’s actual results to differ materially from those expressed or implied by these forward-looking statements, including: (i) the risk that the Proposed Transaction may not be
completed in a timely manner or at all; (ii) the failure to receive, on a timely basis or otherwise, the required approvals of the Proposed Transaction by the Company’s stockholders; (iii) the possibility that any or all of the various conditions to the
consummation of the Proposed Transaction may not be satisfied or waived, including the failure to receive any required regulatory approvals from any applicable governmental entities (or any conditions, limitations or restrictions placed on such approvals);
(iv) the possibility that competing offers or acquisition proposals for the Company will be made; (v) the occurrence of any event, change or other circumstance that could give rise to the termination of the definitive transaction agreement relating to the
Proposed Transaction, including in circumstances which would require the Company to pay a termination fee; (vi) the effect of the announcement or pendency of the Proposed Transaction on the Company’s ability to attract, motivate or retain key executives
and employees, its ability to maintain relationships with its customers, suppliers and other business counterparties, or its operating results and business generally; (vii) risks related to the Proposed Transaction diverting management’s attention from the
Company’s ongoing business operations; (viii) the amount of costs, fees and expenses related to the Proposed Transaction; (ix) the risk that the Company’s stock price may decline significantly if the Proposed Transaction is not consummated; (x) the risk of
shareholder litigation in connection with the Proposed Transaction, including resulting expense or delay; and (xi) (A) the risk factors described in Part I, Item 1A of Risk Factors in the Company’s Annual Report on Form 10-K for the year ended December 31,
2022 and (B) the other risk factors identified from time to time in the Company’s other filings with the SEC. Filings with the SEC are available on the SEC’s website at http://www.sec.gov.
Many of these circumstances are beyond the Company’s ability to control or predict. These forward-looking statements necessarily involve assumptions on the Company’s part. These forward-looking statements generally are identified by the words
“believe,” “expect,” “anticipate,” “intend,” “plan,” “should,” “may,” “will,” “would” or similar expressions. All forward-looking statements attributable to the Company or persons acting on the Company’s behalf are expressly qualified in their entirety by the
cautionary statements that appear throughout this communication. Furthermore, undue reliance should not be placed on forward-looking statements, which are based on the information currently available to the Company and speak only as of the date they
are made. The Company disclaims any intention or obligation to update or revise publicly any forward-looking statements.
Additional Information and Where to Find It
This communication may be deemed to be solicitation material in respect of the Proposed Transaction. The Special Meeting will be held on January 31, 2024 at 9:00 A.M. Central Time, at which meeting the stockholders of the Company will be asked to
consider and vote on a proposal to adopt the merger agreement and approve the Proposed Transaction. In connection with the Proposed Transaction, the Company filed relevant materials with the SEC, including the Proxy Statement. The Company
commenced mailing the Proxy Statement and a proxy card to each stockholder of the Company entitled to vote at the Special Meeting on December 18, 2023. In addition, the Company and certain affiliates of the Company jointly filed an amended
transaction statement on Schedule 13e-3 (the “Schedule 13e-3”). INVESTORS AND STOCKHOLDERS OF THE COMPANY ARE URGED TO READ ALL RELEVANT DOCUMENTS FILED WITH THE SEC, INCLUDING THE PROXY STATEMENT AND
THE SCHEDULE 13E-3, BECAUSE THEY CONTAIN IMPORTANT INFORMATION ABOUT THE COMPANY, SEARCHLIGHT AND BCI AND THE PROPOSED TRANSACTION. Investors and stockholders of the Company are able to obtain these
documents free of charge from the SEC's website at www.sec.gov, or free of charge from the Company by directing a request to the Company at 2116 South 17th Street, Mattoon, IL 61938, Attention: Investor Relations or at tel: +1 (844) 909-2675. |
| 3
Executive Summary
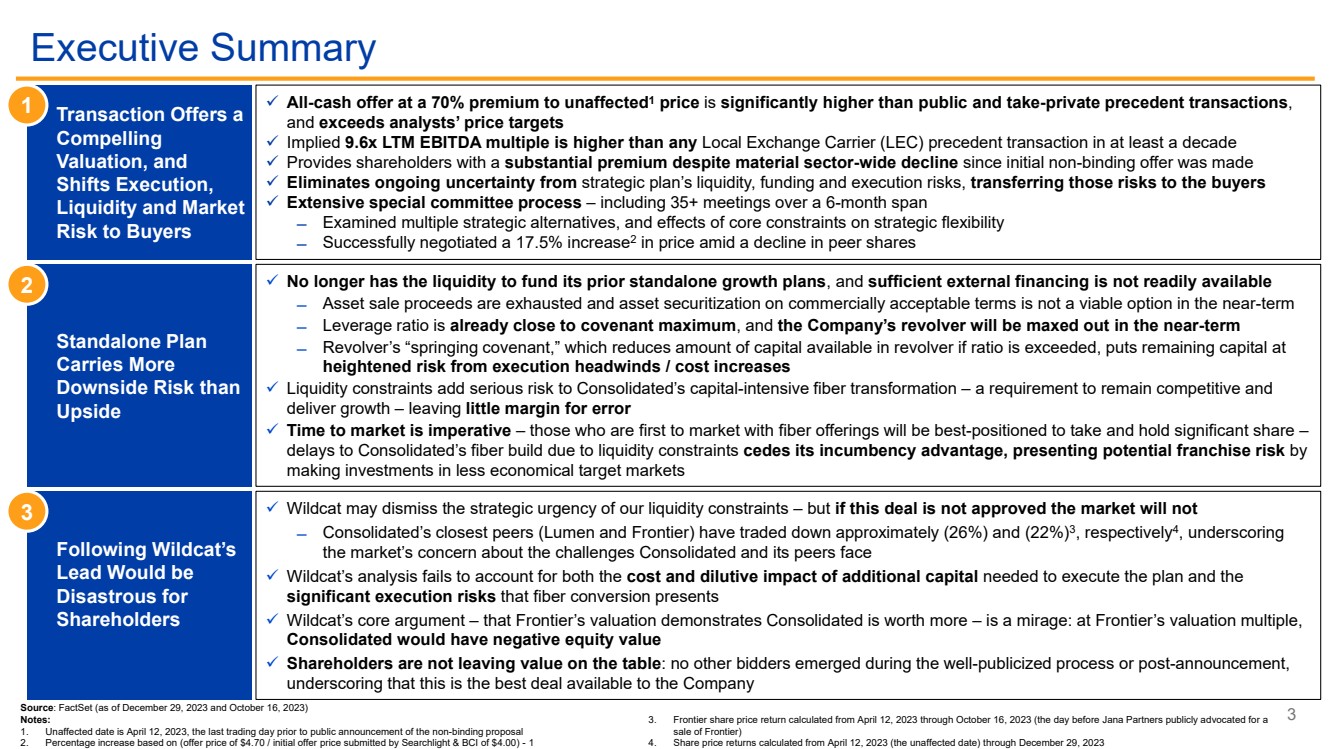
Transaction Offers a
Compelling
Valuation, and
Shifts Execution,
Liquidity and Market
Risk to Buyers
1 ✓ All-cash offer at a 70% premium to unaffected1 price is significantly higher than public and take-private precedent transactions,
and exceeds analysts’ price targets
✓ Implied 9.6x LTM EBITDA multiple is higher than any Local Exchange Carrier (LEC) precedent transaction in at least a decade
✓ Provides shareholders with a substantial premium despite material sector-wide decline since initial non-binding offer was made
✓ Eliminates ongoing uncertainty from strategic plan’s liquidity, funding and execution risks, transferring those risks to the buyers
✓ Extensive special committee process – including 35+ meetings over a 6-month span
̶ Examined multiple strategic alternatives, and effects of core constraints on strategic flexibility
̶ Successfully negotiated a 17.5% increase2
in price amid a decline in peer shares
Standalone Plan
Carries More
Downside Risk than
Upside
2 ✓ No longer has the liquidity to fund its prior standalone growth plans, and sufficient external financing is not readily available
̶ Asset sale proceeds are exhausted and asset securitization on commercially acceptable terms is not a viable option in the near-term
̶ Leverage ratio is already close to covenant maximum, and the Company’s revolver will be maxed out in the near-term
̶ Revolver’s “springing covenant,” which reduces amount of capital available in revolver if ratio is exceeded, puts remaining capital at
heightened risk from execution headwinds / cost increases
✓ Liquidity constraints add serious risk to Consolidated’s capital-intensive fiber transformation – a requirement to remain competitive and
deliver growth – leaving little margin for error
✓ Time to market is imperative – those who are first to market with fiber offerings will be best-positioned to take and hold significant share –
delays to Consolidated’s fiber build due to liquidity constraints cedes its incumbency advantage, presenting potential franchise risk by
making investments in less economical target markets
Following Wildcat’s
Lead Would be
Disastrous for
Shareholders
3 ✓ Wildcat may dismiss the strategic urgency of our liquidity constraints – but if this deal is not approved the market will not
̶ Consolidated’s closest peers (Lumen and Frontier) have traded down approximately (26%) and (22%)3
, respectively4
, underscoring
the market’s concern about the challenges Consolidated and its peers face
✓ Wildcat’s analysis fails to account for both the cost and dilutive impact of additional capital needed to execute the plan and the
significant execution risks that fiber conversion presents
✓ Wildcat’s core argument – that Frontier’s valuation demonstrates Consolidated is worth more – is a mirage: at Frontier’s valuation multiple,
Consolidated would have negative equity value
✓ Shareholders are not leaving value on the table: no other bidders emerged during the well-publicized process or post-announcement,
underscoring that this is the best deal available to the Company
Source: FactSet (as of December 29, 2023 and October 16, 2023)
Notes:
1. Unaffected date is April 12, 2023, the last trading day prior to public announcement of the non-binding proposal
2. Percentage increase based on (offer price of $4.70 / initial offer price submitted by Searchlight & BCI of $4.00) - 1
3. Frontier share price return calculated from April 12, 2023 through October 16, 2023 (the day before Jana Partners publicly advocated for a
sale of Frontier)
4. Share price returns calculated from April 12, 2023 (the unaffected date) through December 29, 2023 |
| 4
Transaction Offers a Compelling Valuation,
and Shifts Execution, Liquidity and Market Risk to Buyers |
| (80%)
(60%)
(40%)
(20%)
-
20%
40%
Apr-22 Oct-23
5
Sources: FactSet (as of October 13, 2023), company filings
Notes:
1. Peers include Frontier Communications Parent, Inc., Lumen Technologies, Inc., Cable One, Inc., Shenandoah Telecommunications Company, ATN International, Inc., WideOpenWest, Inc., Altice USA, Inc. and Charter Communications, Inc.
2. Unaffected date is April 12, 2023, the last trading day prior to public announcement of the non-binding proposal
3. Calendar day VWAPs as of April 12, 2023
Transaction
announced
Monday
Oct 16,
2023
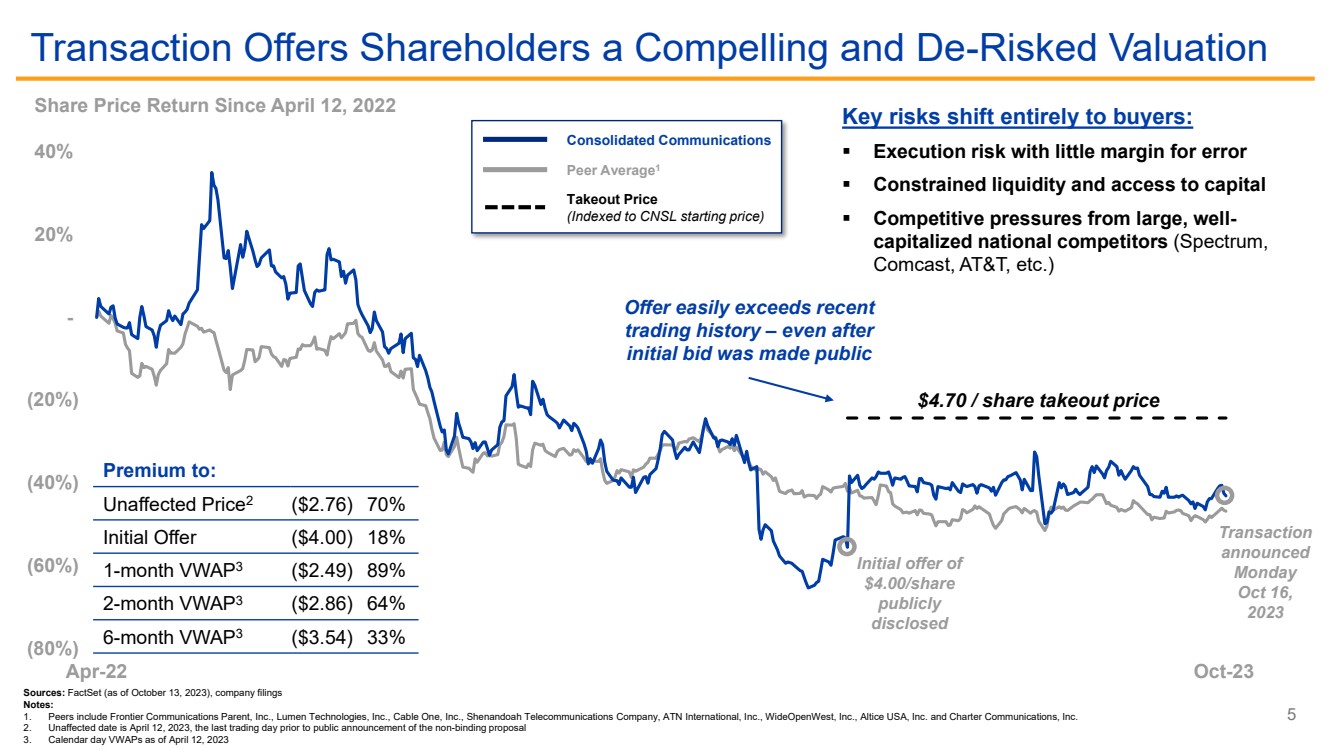
Transaction Offers Shareholders a Compelling and De-Risked Valuation
$4.70 / share takeout price
Premium to:
Unaffected Price2
($2.76) 70%
Initial Offer ($4.00) 18%
1-month VWAP3
($2.49) 89%
2-month VWAP3
($2.86) 64%
6-month VWAP3
($3.54) 33%
Offer easily exceeds recent
trading history – even after
initial bid was made public
Initial offer of
$4.00/share
publicly
disclosed
Key risks shift entirely to buyers:
▪ Execution risk with little margin for error
▪ Constrained liquidity and access to capital
▪ Competitive pressures from large, well-capitalized national competitors (Spectrum,
Comcast, AT&T, etc.)
Consolidated Communications
Peer Average1
Takeout Price
(Indexed to CNSL starting price)
Share Price Return Since April 12, 2022 |
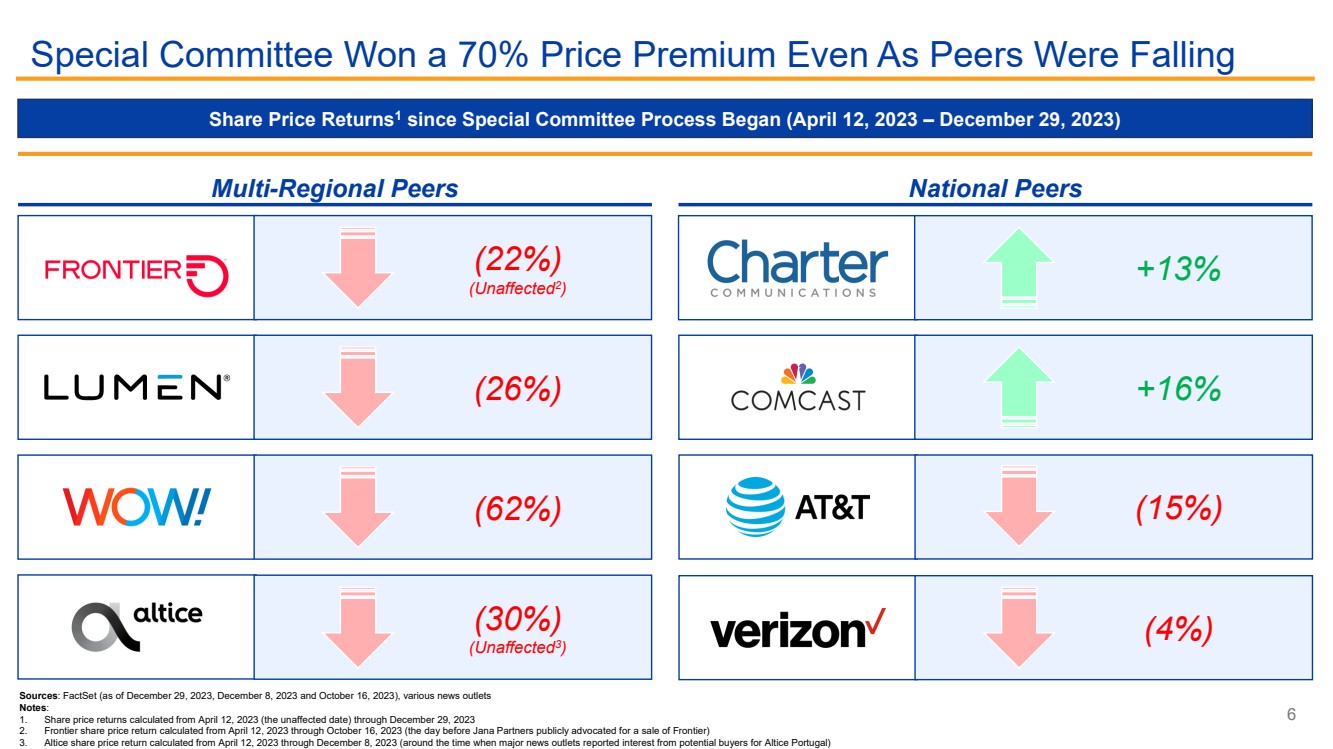
| (22%)
(Unaffected2
)
+13%
(26%) +16%
(62%)
(30%)
(Unaffected3
)
6
Special Committee Won a 70% Price Premium Even As Peers Were Falling
Share Price Returns1 since Special Committee Process Began (April 12, 2023 – December 29, 2023)
Sources: FactSet (as of December 29, 2023, December 8, 2023 and October 16, 2023), various news outlets
Notes:
1. Share price returns calculated from April 12, 2023 (the unaffected date) through December 29, 2023
2. Frontier share price return calculated from April 12, 2023 through October 16, 2023 (the day before Jana Partners publicly advocated for a sale of Frontier)
3. Altice share price return calculated from April 12, 2023 through December 8, 2023 (around the time when major news outlets reported interest from potential buyers for Altice Portugal)
Multi-Regional Peers National Peers
(4%)
(15%) |
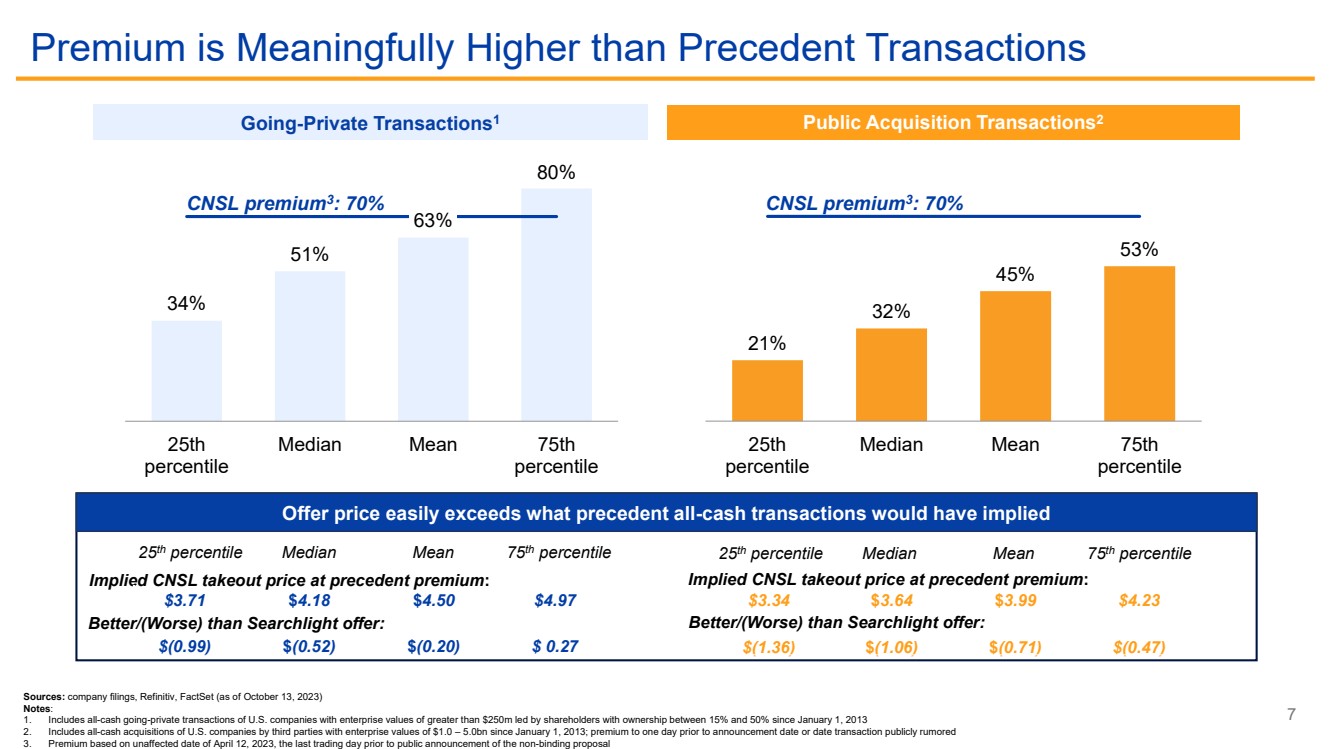
| 34%
51%
63%
80%
25th
percentile
Median Mean 75th
percentile
21%
32%
45%
53%
25th
percentile
Median Mean 75th
percentile
7
Premium is Meaningfully Higher than Precedent Transactions
Sources: company filings, Refinitiv, FactSet (as of October 13, 2023)
Notes:
1. Includes all-cash going-private transactions of U.S. companies with enterprise values of greater than $250m led by shareholders with ownership between 15% and 50% since January 1, 2013
2. Includes all-cash acquisitions of U.S. companies by third parties with enterprise values of $1.0 – 5.0bn since January 1, 2013; premium to one day prior to announcement date or date transaction publicly rumored
3. Premium based on unaffected date of April 12, 2023, the last trading day prior to public announcement of the non-binding proposal
Offer price easily exceeds what precedent all-cash transactions would have implied
Implied CNSL takeout price at precedent premium:
Better/(Worse) than Searchlight offer:
$3.34
$(1.36)
$3.64
$(1.06)
$3.99
$(0.71)
$4.23
$(0.47)
Implied CNSL takeout price at precedent premium:
Better/(Worse) than Searchlight offer:
$3.71
$(0.99)
$4.18
$(0.52)
$4.50
$(0.20)
$4.97
$ 0.27
25th percentile Median Mean 75th percentile 25th percentile Median Mean 75th percentile
Going-Private Transactions1 Public Acquisition Transactions2
CNSL premium3 CNSL premium3
: 70% : 70% |
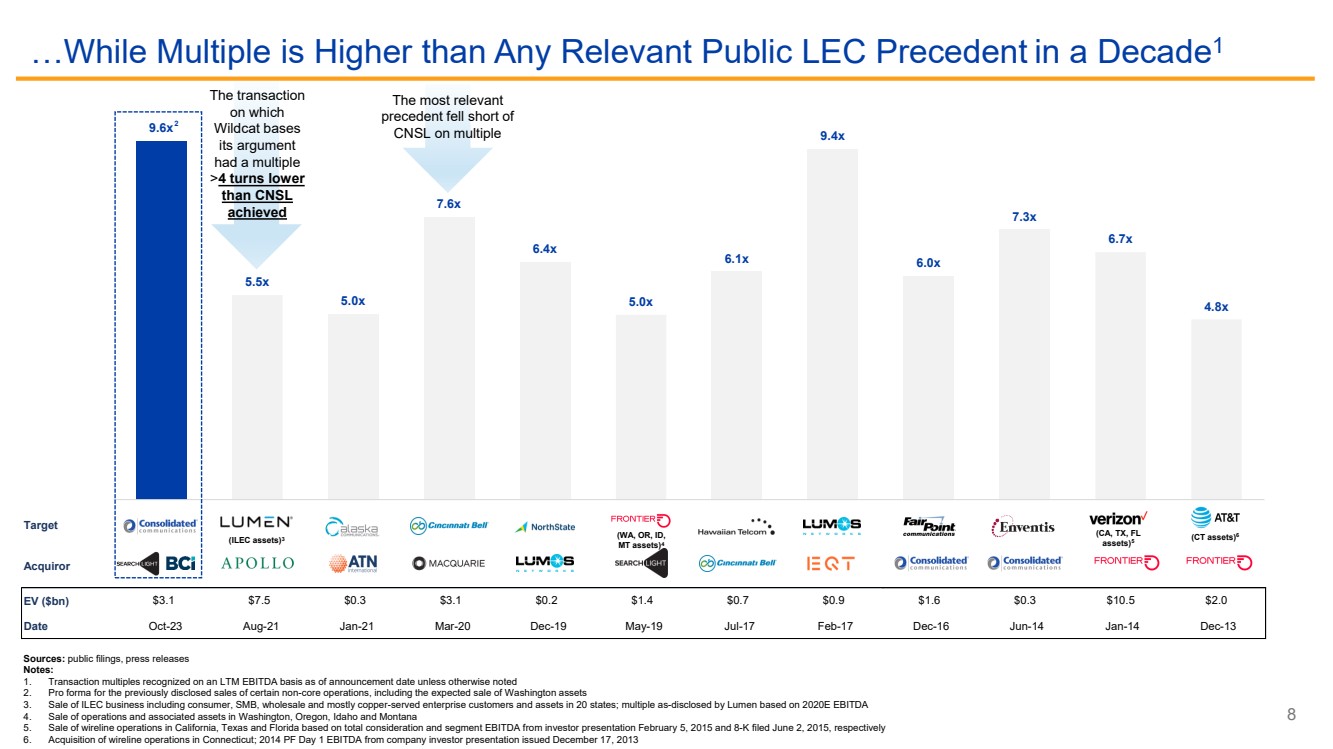
| 9.6x
5.5x
5.0x
7.6x
6.4x
5.0x
6.1x
9.4x
6.0x
7.3x
6.7x
4.8x
Target
Acquiror
EV ($bn) $3.1 $7.5 $0.3 $3.1 $0.2 $1.4 $0.7 $0.9 $1.6 $0.3 $10.5 $2.0
Date Oct-23 Aug-21 Jan-21 Mar-20 Dec-19 May-19 Jul-17 Feb-17 Dec-16 Jun-14 Jan-14 Dec-13
8
…While Multiple is Higher than Any Relevant Public LEC Precedent in a Decade1
Sources: public filings, press releases
Notes:
1. Transaction multiples recognized on an LTM EBITDA basis as of announcement date unless otherwise noted
2. Pro forma for the previously disclosed sales of certain non-core operations, including the expected sale of Washington assets
3. Sale of ILEC business including consumer, SMB, wholesale and mostly copper-served enterprise customers and assets in 20 states; multiple as-disclosed by Lumen based on 2020E EBITDA
4. Sale of operations and associated assets in Washington, Oregon, Idaho and Montana
5. Sale of wireline operations in California, Texas and Florida based on total consideration and segment EBITDA from investor presentation February 5, 2015 and 8-K filed June 2, 2015, respectively
6. Acquisition of wireline operations in Connecticut; 2014 PF Day 1 EBITDA from company investor presentation issued December 17, 2013
(CA, TX, FL
assets)5
(CT assets) (WA, OR, ID, 6
MT assets)4
(ILEC assets)3
2
The transaction
on which
Wildcat bases
its argument
had a multiple
>4 turns lower
than CNSL
achieved
The most relevant
precedent fell short of
CNSL on multiple
2 |
| 14%
(1%)
(60%)
(40%)
(20%)
-
20%
40%
Dec-22 Feb-23 Apr-23 Jun-23 Aug-23 Oct-23 Dec-23
2
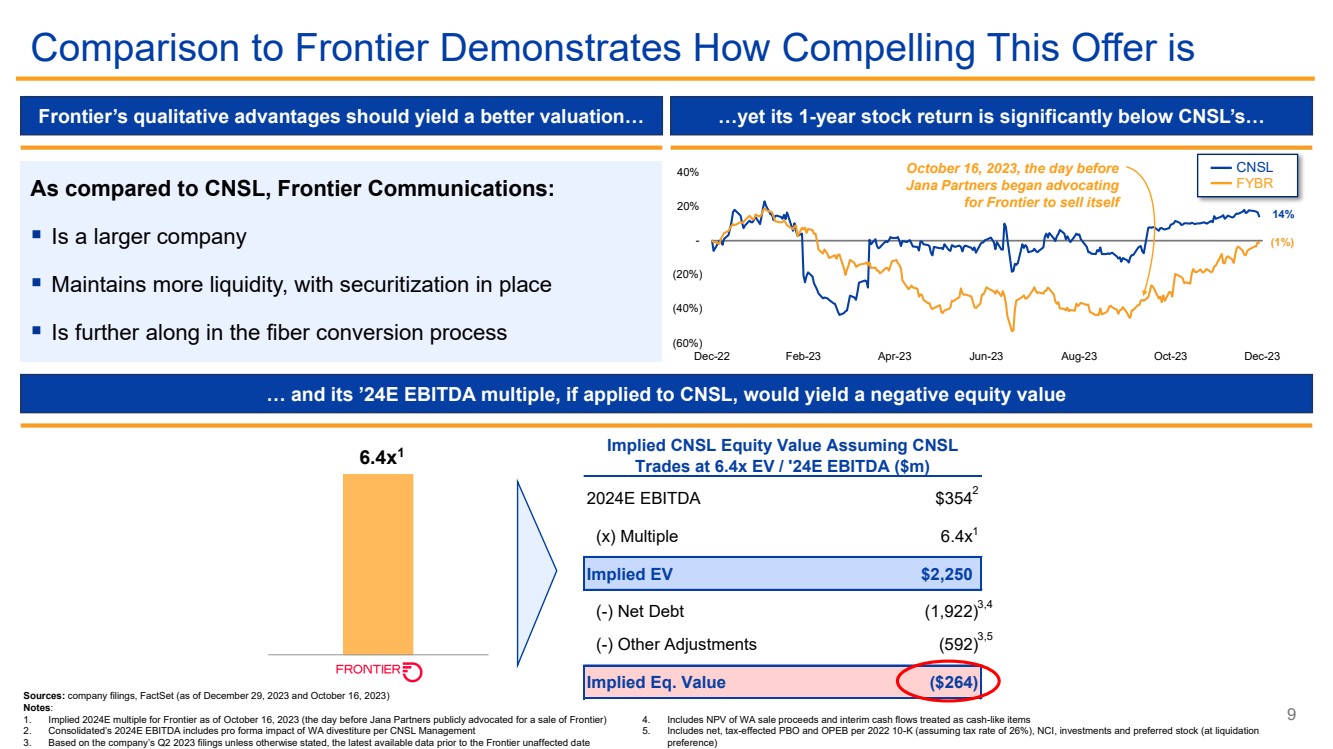
2024E EBITDA $354
(x) Multiple 6.4x
Implied EV $2,250
(-) Net Debt (1,922)
(-) Other Adjustments (592)
Implied Eq. Value ($264)
Implied CNSL Equity Value Assuming CNSL
Trades at 6.4x EV / '24E EBITDA ($m) 6.4x
FYBR
…yet its 1-year stock return is significantly below CNSL’s…
9
Comparison to Frontier Demonstrates How Compelling This Offer is
Frontier’s qualitative advantages should yield a better valuation…
… and its ’24E EBITDA multiple, if applied to CNSL, would yield a negative equity value
As compared to CNSL, Frontier Communications:
▪ Is a larger company
▪ Maintains more liquidity, with securitization in place
▪ Is further along in the fiber conversion process
October 16, 2023, the day before
Jana Partners began advocating
for Frontier to sell itself
CNSL
FYBR
Sources: company filings, FactSet (as of December 29, 2023 and October 16, 2023)
Notes:
1. Implied 2024E multiple for Frontier as of October 16, 2023 (the day before Jana Partners publicly advocated for a sale of Frontier)
2. Consolidated’s 2024E EBITDA includes pro forma impact of WA divestiture per CNSL Management
3. Based on the company’s Q2 2023 filings unless otherwise stated, the latest available data prior to the Frontier unaffected date
4. Includes NPV of WA sale proceeds and interim cash flows treated as cash-like items
5. Includes net, tax-effected PBO and OPEB per 2022 10-K (assuming tax rate of 26%), NCI, investments and preferred stock (at liquidation
preference)
1
1
3,4
3,5 |
| 10
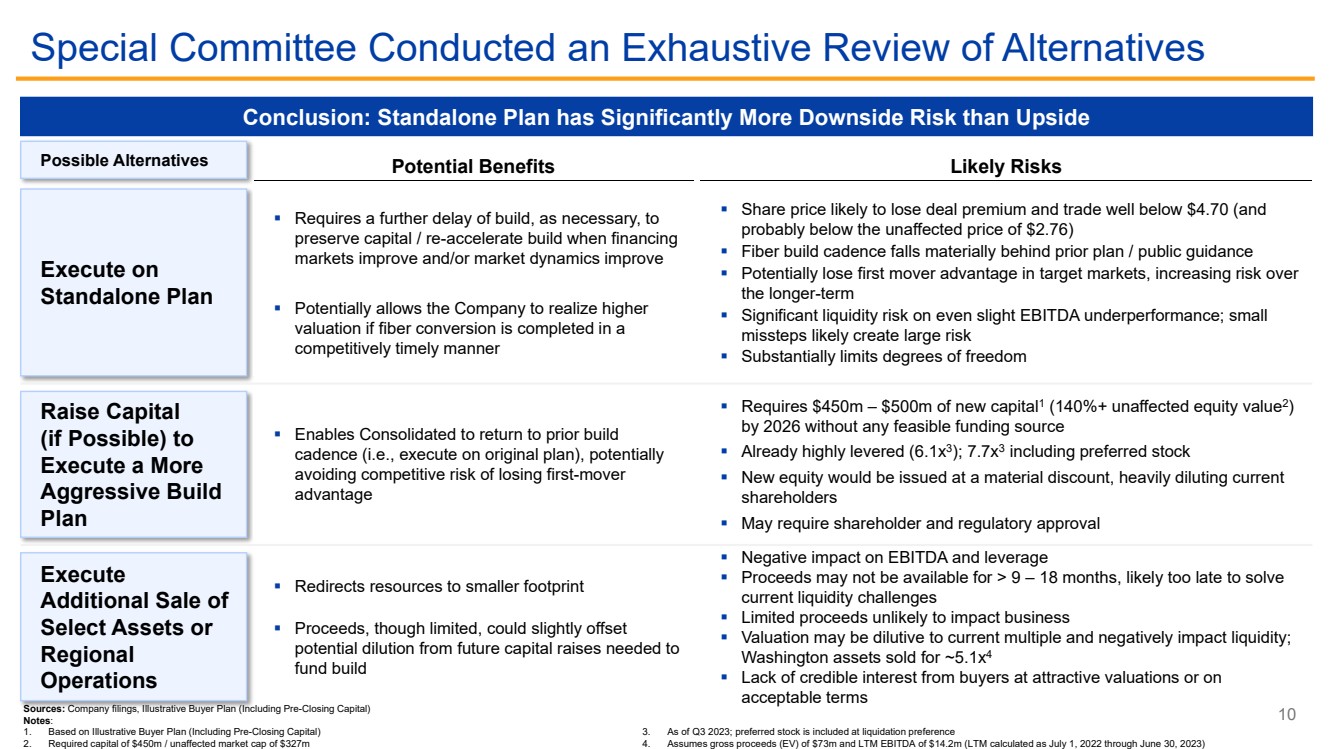
Special Committee Conducted an Exhaustive Review of Alternatives
Conclusion: Standalone Plan has Significantly More Downside Risk than Upside
Execute on
Standalone Plan
▪ Requires a further delay of build, as necessary, to
preserve capital / re-accelerate build when financing
markets improve and/or market dynamics improve
▪ Potentially allows the Company to realize higher
valuation if fiber conversion is completed in a
competitively timely manner
▪ Share price likely to lose deal premium and trade well below $4.70 (and
probably below the unaffected price of $2.76)
▪ Fiber build cadence falls materially behind prior plan / public guidance
▪ Potentially lose first mover advantage in target markets, increasing risk over
the longer-term
▪ Significant liquidity risk on even slight EBITDA underperformance; small
missteps likely create large risk
▪ Substantially limits degrees of freedom
Raise Capital
(if Possible) to
Execute a More
Aggressive Build
Plan
▪ Enables Consolidated to return to prior build
cadence (i.e., execute on original plan), potentially
avoiding competitive risk of losing first-mover
advantage
▪ Requires $450m – $500m of new capital1
(140%+ unaffected equity value2
)
by 2026 without any feasible funding source
▪ Already highly levered (6.1x3
); 7.7x3
including preferred stock
▪ New equity would be issued at a material discount, heavily diluting current
shareholders
▪ May require shareholder and regulatory approval
▪ Redirects resources to smaller footprint
▪ Proceeds, though limited, could slightly offset
potential dilution from future capital raises needed to
fund build
Execute
Additional Sale of
Select Assets or
Regional
Operations
▪ Negative impact on EBITDA and leverage
▪ Proceeds may not be available for > 9 – 18 months, likely too late to solve
current liquidity challenges
▪ Limited proceeds unlikely to impact business
▪ Valuation may be dilutive to current multiple and negatively impact liquidity;
Washington assets sold for ~5.1x4
▪ Lack of credible interest from buyers at attractive valuations or on
acceptable terms
Potential Benefits Likely Risks
Sources: Company filings, Illustrative Buyer Plan (Including Pre-Closing Capital)
Notes:
1. Based on Illustrative Buyer Plan (Including Pre-Closing Capital)
2. Required capital of $450m / unaffected market cap of $327m
3. As of Q3 2023; preferred stock is included at liquidation preference
4. Assumes gross proceeds (EV) of $73m and LTM EBITDA of $14.2m (LTM calculated as July 1, 2022 through June 30, 2023)
Possible Alternatives |
| 11
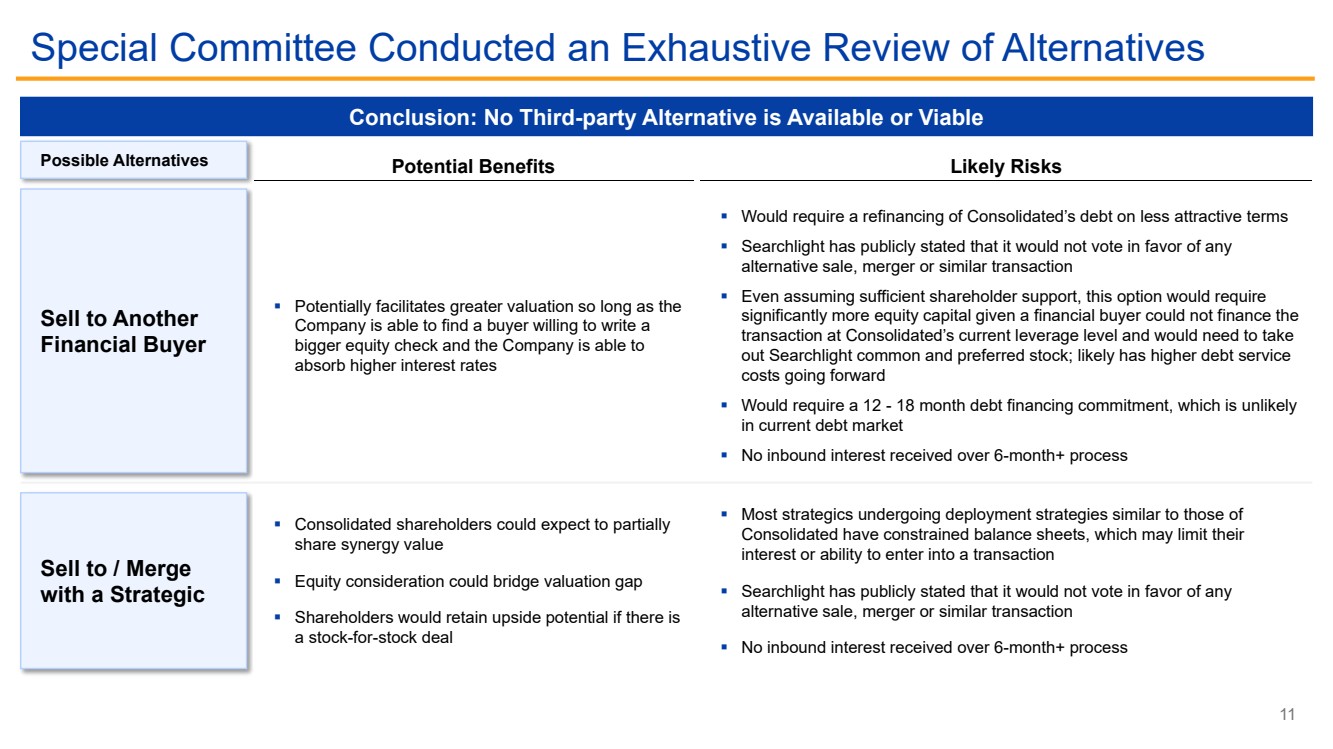
Special Committee Conducted an Exhaustive Review of Alternatives
Conclusion: No Third-party Alternative is Available or Viable
Sell to Another
Financial Buyer
▪ Potentially facilitates greater valuation so long as the
Company is able to find a buyer willing to write a
bigger equity check and the Company is able to
absorb higher interest rates
▪ Would require a refinancing of Consolidated’s debt on less attractive terms
▪ Searchlight has publicly stated that it would not vote in favor of any
alternative sale, merger or similar transaction
▪ Even assuming sufficient shareholder support, this option would require
significantly more equity capital given a financial buyer could not finance the
transaction at Consolidated’s current leverage level and would need to take
out Searchlight common and preferred stock; likely has higher debt service
costs going forward
▪ Would require a 12 - 18 month debt financing commitment, which is unlikely
in current debt market
▪ No inbound interest received over 6-month+ process
Sell to / Merge
with a Strategic
▪ Consolidated shareholders could expect to partially
share synergy value
▪ Equity consideration could bridge valuation gap
▪ Shareholders would retain upside potential if there is
a stock-for-stock deal
▪ Most strategics undergoing deployment strategies similar to those of
Consolidated have constrained balance sheets, which may limit their
interest or ability to enter into a transaction
▪ Searchlight has publicly stated that it would not vote in favor of any
alternative sale, merger or similar transaction
▪ No inbound interest received over 6-month+ process
Potential Benefits Likely Risks Possible Alternatives |
| 12
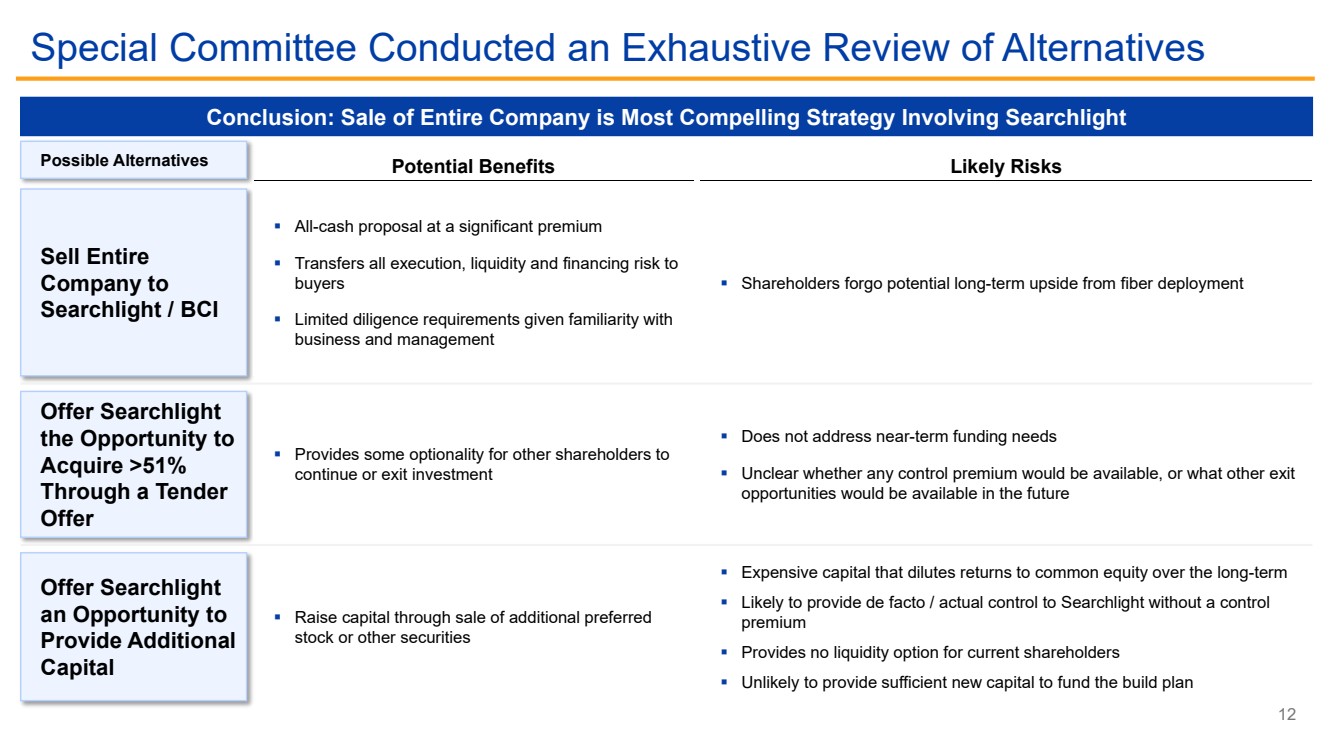
Special Committee Conducted an Exhaustive Review of Alternatives
Conclusion: Sale of Entire Company is Most Compelling Strategy Involving Searchlight
Sell Entire
Company to
Searchlight / BCI
▪ All-cash proposal at a significant premium
▪ Transfers all execution, liquidity and financing risk to
buyers
▪ Limited diligence requirements given familiarity with
business and management
▪ Shareholders forgo potential long-term upside from fiber deployment
Offer Searchlight
the Opportunity to
Acquire >51%
Through a Tender
Offer
▪ Provides some optionality for other shareholders to
continue or exit investment
▪ Does not address near-term funding needs
▪ Unclear whether any control premium would be available, or what other exit
opportunities would be available in the future
▪ Raise capital through sale of additional preferred
stock or other securities
Offer Searchlight
an Opportunity to
Provide Additional
Capital
▪ Expensive capital that dilutes returns to common equity over the long-term
▪ Likely to provide de facto / actual control to Searchlight without a control
premium
▪ Provides no liquidity option for current shareholders
▪ Unlikely to provide sufficient new capital to fund the build plan
Potential Benefits Likely Risks Possible Alternatives |
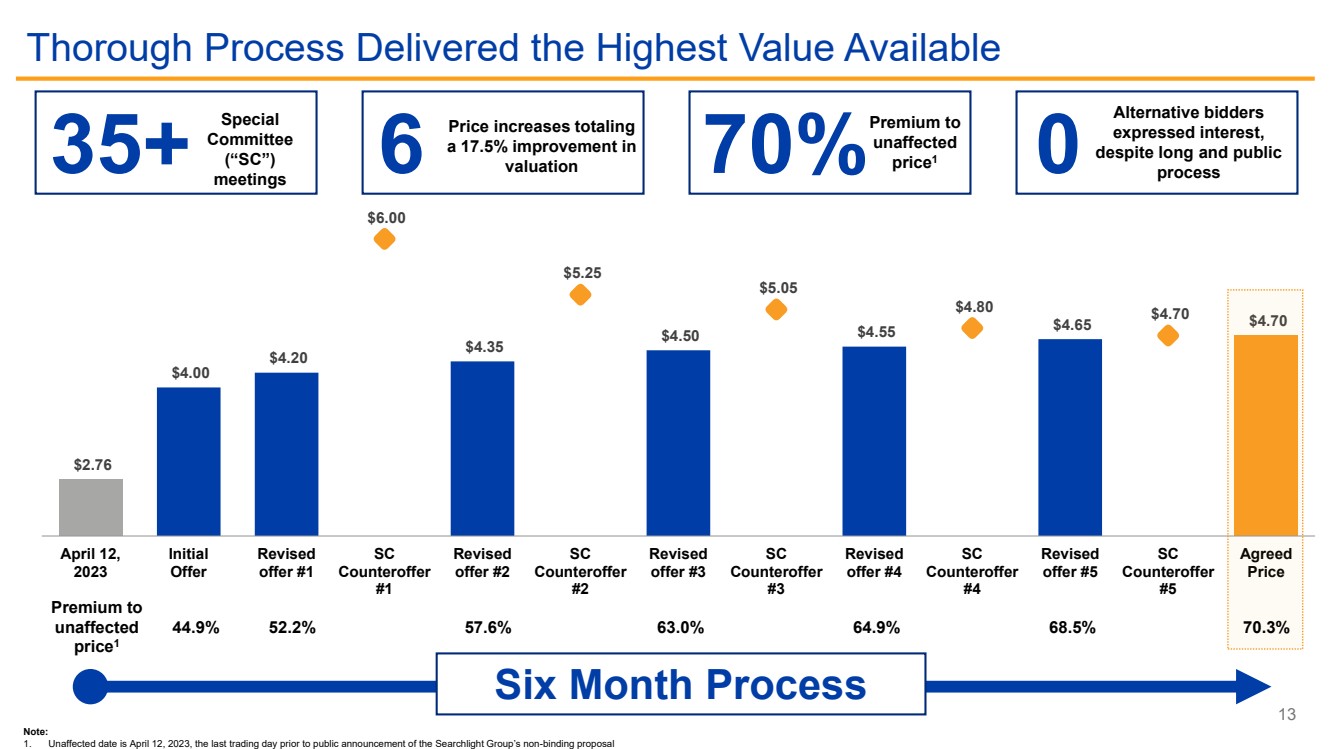
| $2.76
$4.00
$4.20 $4.35 $4.50 $4.55 $4.65 $4.70
$6.00
$5.25
$5.05
$4.80 $4.70
April 12,
2023
Initial
Offer
Revised
offer #1
SC
Counteroffer
#1
Revised
offer #2
SC
Counteroffer
#2
Revised
offer #3
SC
Counteroffer
#3
Revised
offer #4
SC
Counteroffer
#4
Revised
offer #5
SC
Counteroffer
#5
Agreed
Price
Chart Title
13
Thorough Process Delivered the Highest Value Available
Note:
1. Unaffected date is April 12, 2023, the last trading day prior to public announcement of the Searchlight Group’s non-binding proposal
Six Month Process
Premium to
unaffected
price1
44.9% 52.2% 57.6% 63.0% 64.9% 68.5% 70.3%
35+ Special
Committee
(“SC”)
meetings 0
Alternative bidders
expressed interest,
despite long and public 6 process
Price increases totaling
a 17.5% improvement in
valuation 70%Premium to
unaffected
price1 |
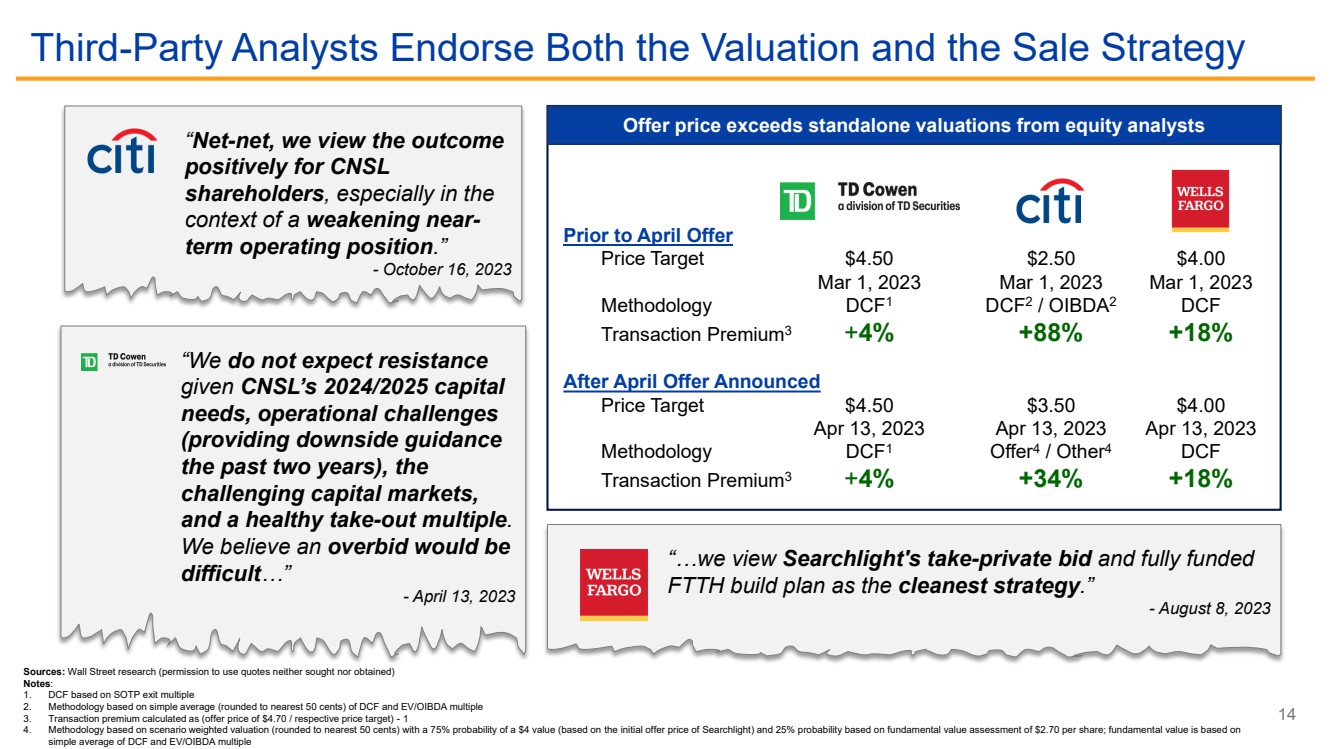
| Prior to April Offer
Price Target $4.50 $2.50 $4.00
Mar 1, 2023 Mar 1, 2023 Mar 1, 2023
Methodology DCF1 DCF2
/ OIBDA2 DCF
Transaction Premium3 +4% +88% +18%
After April Offer Announced
Price Target $4.50 $3.50 $4.00
Apr 13, 2023 Apr 13, 2023 Apr 13, 2023
Methodology DCF1 Offer4
/ Other4 DCF
Transaction Premium3 +4% +34% +18%
“…we view Searchlight's take-private bid and fully funded
FTTH build plan as the cleanest strategy.”
- August 8, 2023
14
Third-Party Analysts Endorse Both the Valuation and the Sale Strategy
Sources: Wall Street research (permission to use quotes neither sought nor obtained)
Notes:
1. DCF based on SOTP exit multiple
2. Methodology based on simple average (rounded to nearest 50 cents) of DCF and EV/OIBDA multiple
3. Transaction premium calculated as (offer price of $4.70 / respective price target) - 1
4. Methodology based on scenario weighted valuation (rounded to nearest 50 cents) with a 75% probability of a $4 value (based on the initial offer price of Searchlight) and 25% probability based on fundamental value assessment of $2.70 per share; fundamental value is based on
simple average of DCF and EV/OIBDA multiple
“Net-net, we view the outcome
positively for CNSL
shareholders, especially in the
context of a weakening near-term operating position.”
- October 16, 2023
“We do not expect resistance
given CNSL’s 2024/2025 capital
needs, operational challenges
(providing downside guidance
the past two years), the
challenging capital markets,
and a healthy take-out multiple.
We believe an overbid would be
difficult…”
- April 13, 2023
Offer price exceeds standalone valuations from equity analysts |
| 15
Standalone Plan Carries More Downside Risk than Upside |
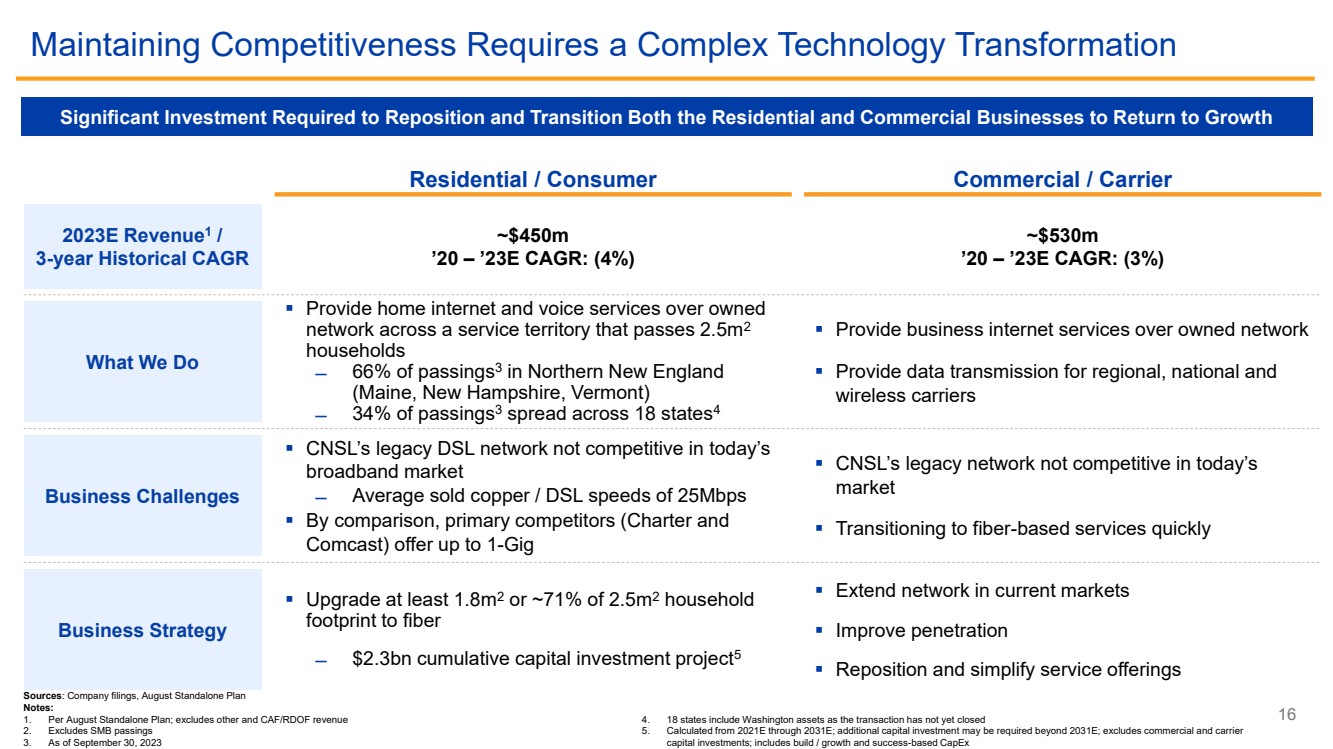
| Significant Investment Required to Reposition and Transition Both the Residential and Commercial Businesses to Return to Growth
16
Maintaining Competitiveness Requires a Complex Technology Transformation
Residential / Consumer Commercial / Carrier
2023E Revenue1
/
3-year Historical CAGR
~$450m
’20 – ’23E CAGR: (4%)
~$530m
’20 – ’23E CAGR: (3%)
Business Challenges
▪ CNSL’s legacy DSL network not competitive in today’s
broadband market
̶ Average sold copper / DSL speeds of 25Mbps
▪ By comparison, primary competitors (Charter and
Comcast) offer up to 1-Gig
▪ CNSL’s legacy network not competitive in today’s
market
▪ Transitioning to fiber-based services quickly
Business Strategy
▪ Upgrade at least 1.8m2 or ~71% of 2.5m2 household
footprint to fiber
̶ $2.3bn cumulative capital investment project5
▪ Extend network in current markets
▪ Improve penetration
▪ Reposition and simplify service offerings
What We Do
▪ Provide business internet services over owned network
▪ Provide data transmission for regional, national and
wireless carriers
▪ Provide home internet and voice services over owned
network across a service territory that passes 2.5m2
households
̶ 66% of passings3
in Northern New England
(Maine, New Hampshire, Vermont)
̶ 34% of passings3 spread across 18 states4
Sources: Company filings, August Standalone Plan
Notes:
1. Per August Standalone Plan; excludes other and CAF/RDOF revenue
2. Excludes SMB passings
3. As of September 30, 2023
4. 18 states include Washington assets as the transaction has not yet closed
5. Calculated from 2021E through 2031E; additional capital investment may be required beyond 2031E; excludes commercial and carrier
capital investments; includes build / growth and success-based CapEx |
| 4.0x
4.5x
3.9x
4.2x
4.8x
5.5x 5.7x
6.2x
1Q22 2Q22 3Q22 4Q22 1Q23 2Q23 3Q23 4Q23
17
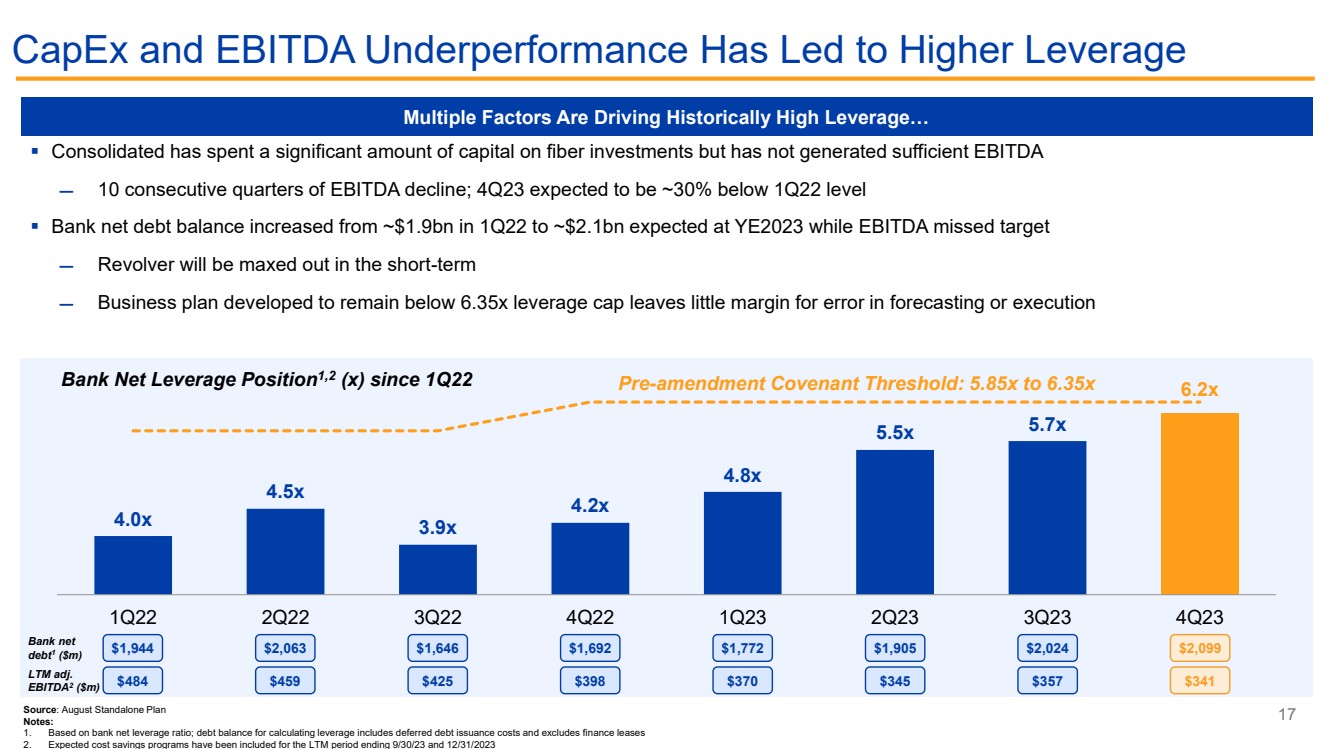
CapEx and EBITDA Underperformance Has Led to Higher Leverage
▪ Consolidated has spent a significant amount of capital on fiber investments but has not generated sufficient EBITDA
̶ 10 consecutive quarters of EBITDA decline; 4Q23 expected to be ~30% below 1Q22 level
▪ Bank net debt balance increased from ~$1.9bn in 1Q22 to ~$2.1bn expected at YE2023 while EBITDA missed target
̶ Revolver will be maxed out in the short-term
̶ Business plan developed to remain below 6.35x leverage cap leaves little margin for error in forecasting or execution
Bank Net Leverage Position1,2 (x) since 1Q22
Multiple Factors Are Driving Historically High Leverage…
Pre-amendment Covenant Threshold: 5.85x to 6.35x
Source: August Standalone Plan
Notes:
1. Based on bank net leverage ratio; debt balance for calculating leverage includes deferred debt issuance costs and excludes finance leases
2. Expected cost savings programs have been included for the LTM period ending 9/30/23 and 12/31/2023
Bank net
debt1
($m)
LTM adj.
EBITDA2
($m)
$1,944 $2,063 $1,646 $1,692 $1,772 $1,905 $2,024 $2,099
$484 $459 $425 $398 $370 $345 $357 $341 |
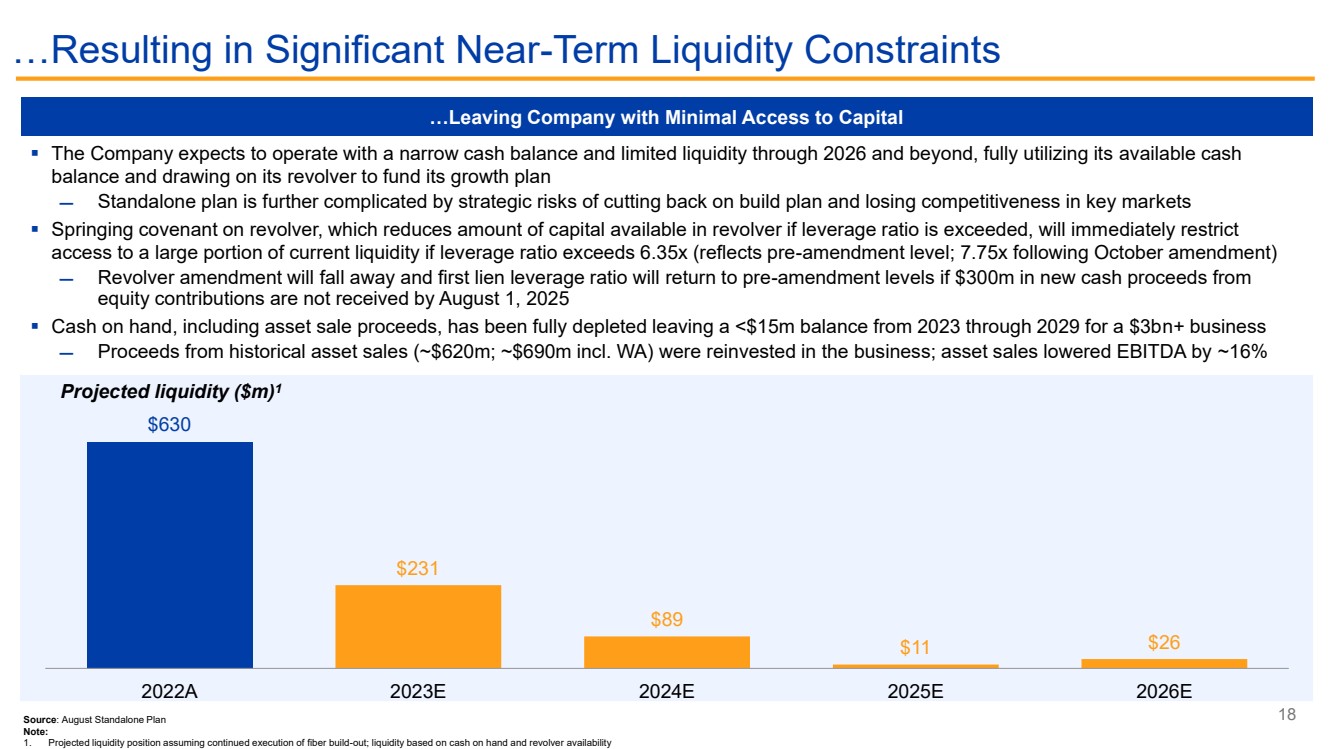
| $630
$231
$89
$11 $26
2022A 2023E 2024E 2025E 2026E
18
…Resulting in Significant Near-Term Liquidity Constraints
▪ The Company expects to operate with a narrow cash balance and limited liquidity through 2026 and beyond, fully utilizing its available cash
balance and drawing on its revolver to fund its growth plan
̶ Standalone plan is further complicated by strategic risks of cutting back on build plan and losing competitiveness in key markets
▪ Springing covenant on revolver, which reduces amount of capital available in revolver if leverage ratio is exceeded, will immediately restrict
access to a large portion of current liquidity if leverage ratio exceeds 6.35x (reflects pre-amendment level; 7.75x following October amendment)
̶ Revolver amendment will fall away and first lien leverage ratio will return to pre-amendment levels if $300m in new cash proceeds from
equity contributions are not received by August 1, 2025
▪ Cash on hand, including asset sale proceeds, has been fully depleted leaving a <$15m balance from 2023 through 2029 for a $3bn+ business
̶ Proceeds from historical asset sales (~$620m; ~$690m incl. WA) were reinvested in the business; asset sales lowered EBITDA by ~16%
Projected liquidity ($m)1
…Leaving Company with Minimal Access to Capital
Source: August Standalone Plan
Note:
1. Projected liquidity position assuming continued execution of fiber build-out; liquidity based on cash on hand and revolver availability |
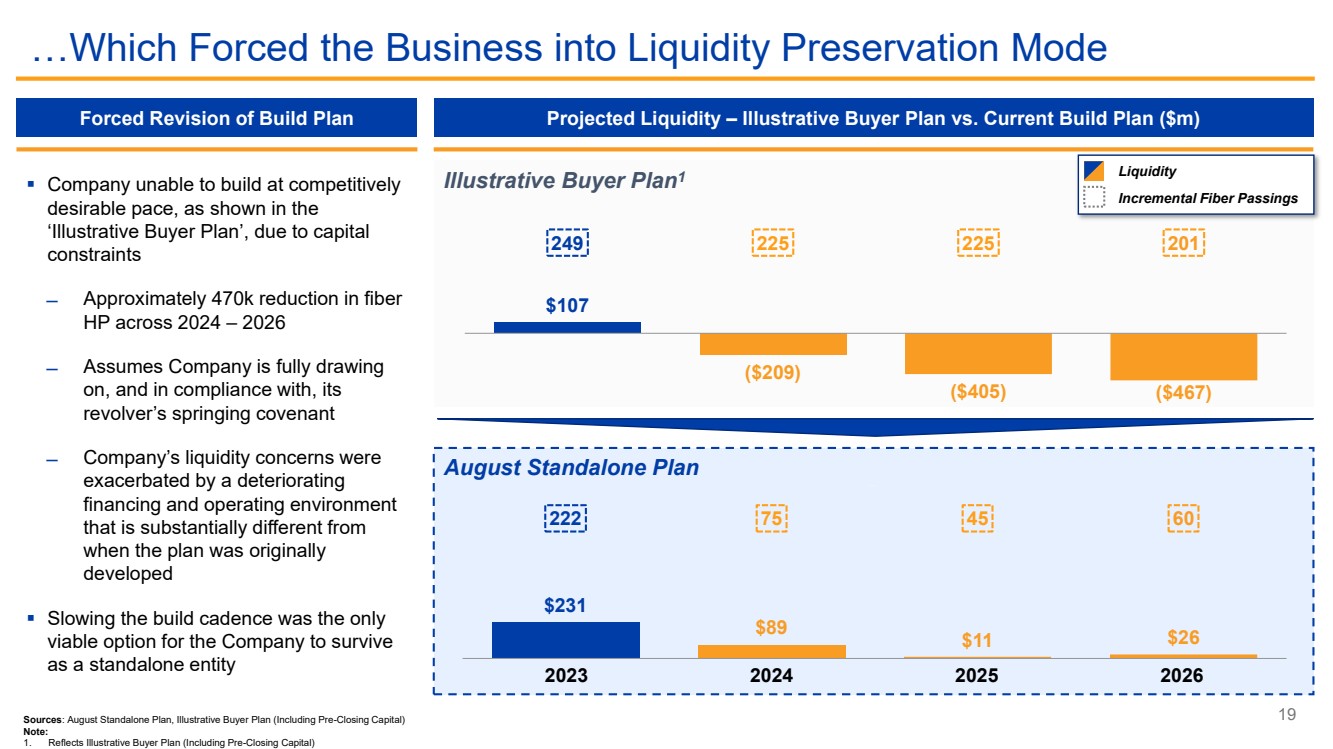
| Liquidity
Incremental Fiber Passings
19
…Which Forced the Business into Liquidity Preservation Mode
Sources: August Standalone Plan, Illustrative Buyer Plan (Including Pre-Closing Capital)
Note:
1. Reflects Illustrative Buyer Plan (Including Pre-Closing Capital)
Illustrative Buyer Plan1
August Standalone Plan
Forced Revision of Build Plan Projected Liquidity – Illustrative Buyer Plan vs. Current Build Plan ($m)
▪ Company unable to build at competitively
desirable pace, as shown in the
‘Illustrative Buyer Plan’, due to capital
constraints
̶ Approximately 470k reduction in fiber
HP across 2024 – 2026
̶ Assumes Company is fully drawing
on, and in compliance with, its
revolver’s springing covenant
̶ Company’s liquidity concerns were
exacerbated by a deteriorating
financing and operating environment
that is substantially different from
when the plan was originally
developed
▪ Slowing the build cadence was the only
viable option for the Company to survive
as a standalone entity
$107
($209)
($405) ($467)
249 225 225 201
Total Liquidity
$231
$89 $11 $26
222 75 45 60
Total Liquidity
2023 2024 2025 2026 |
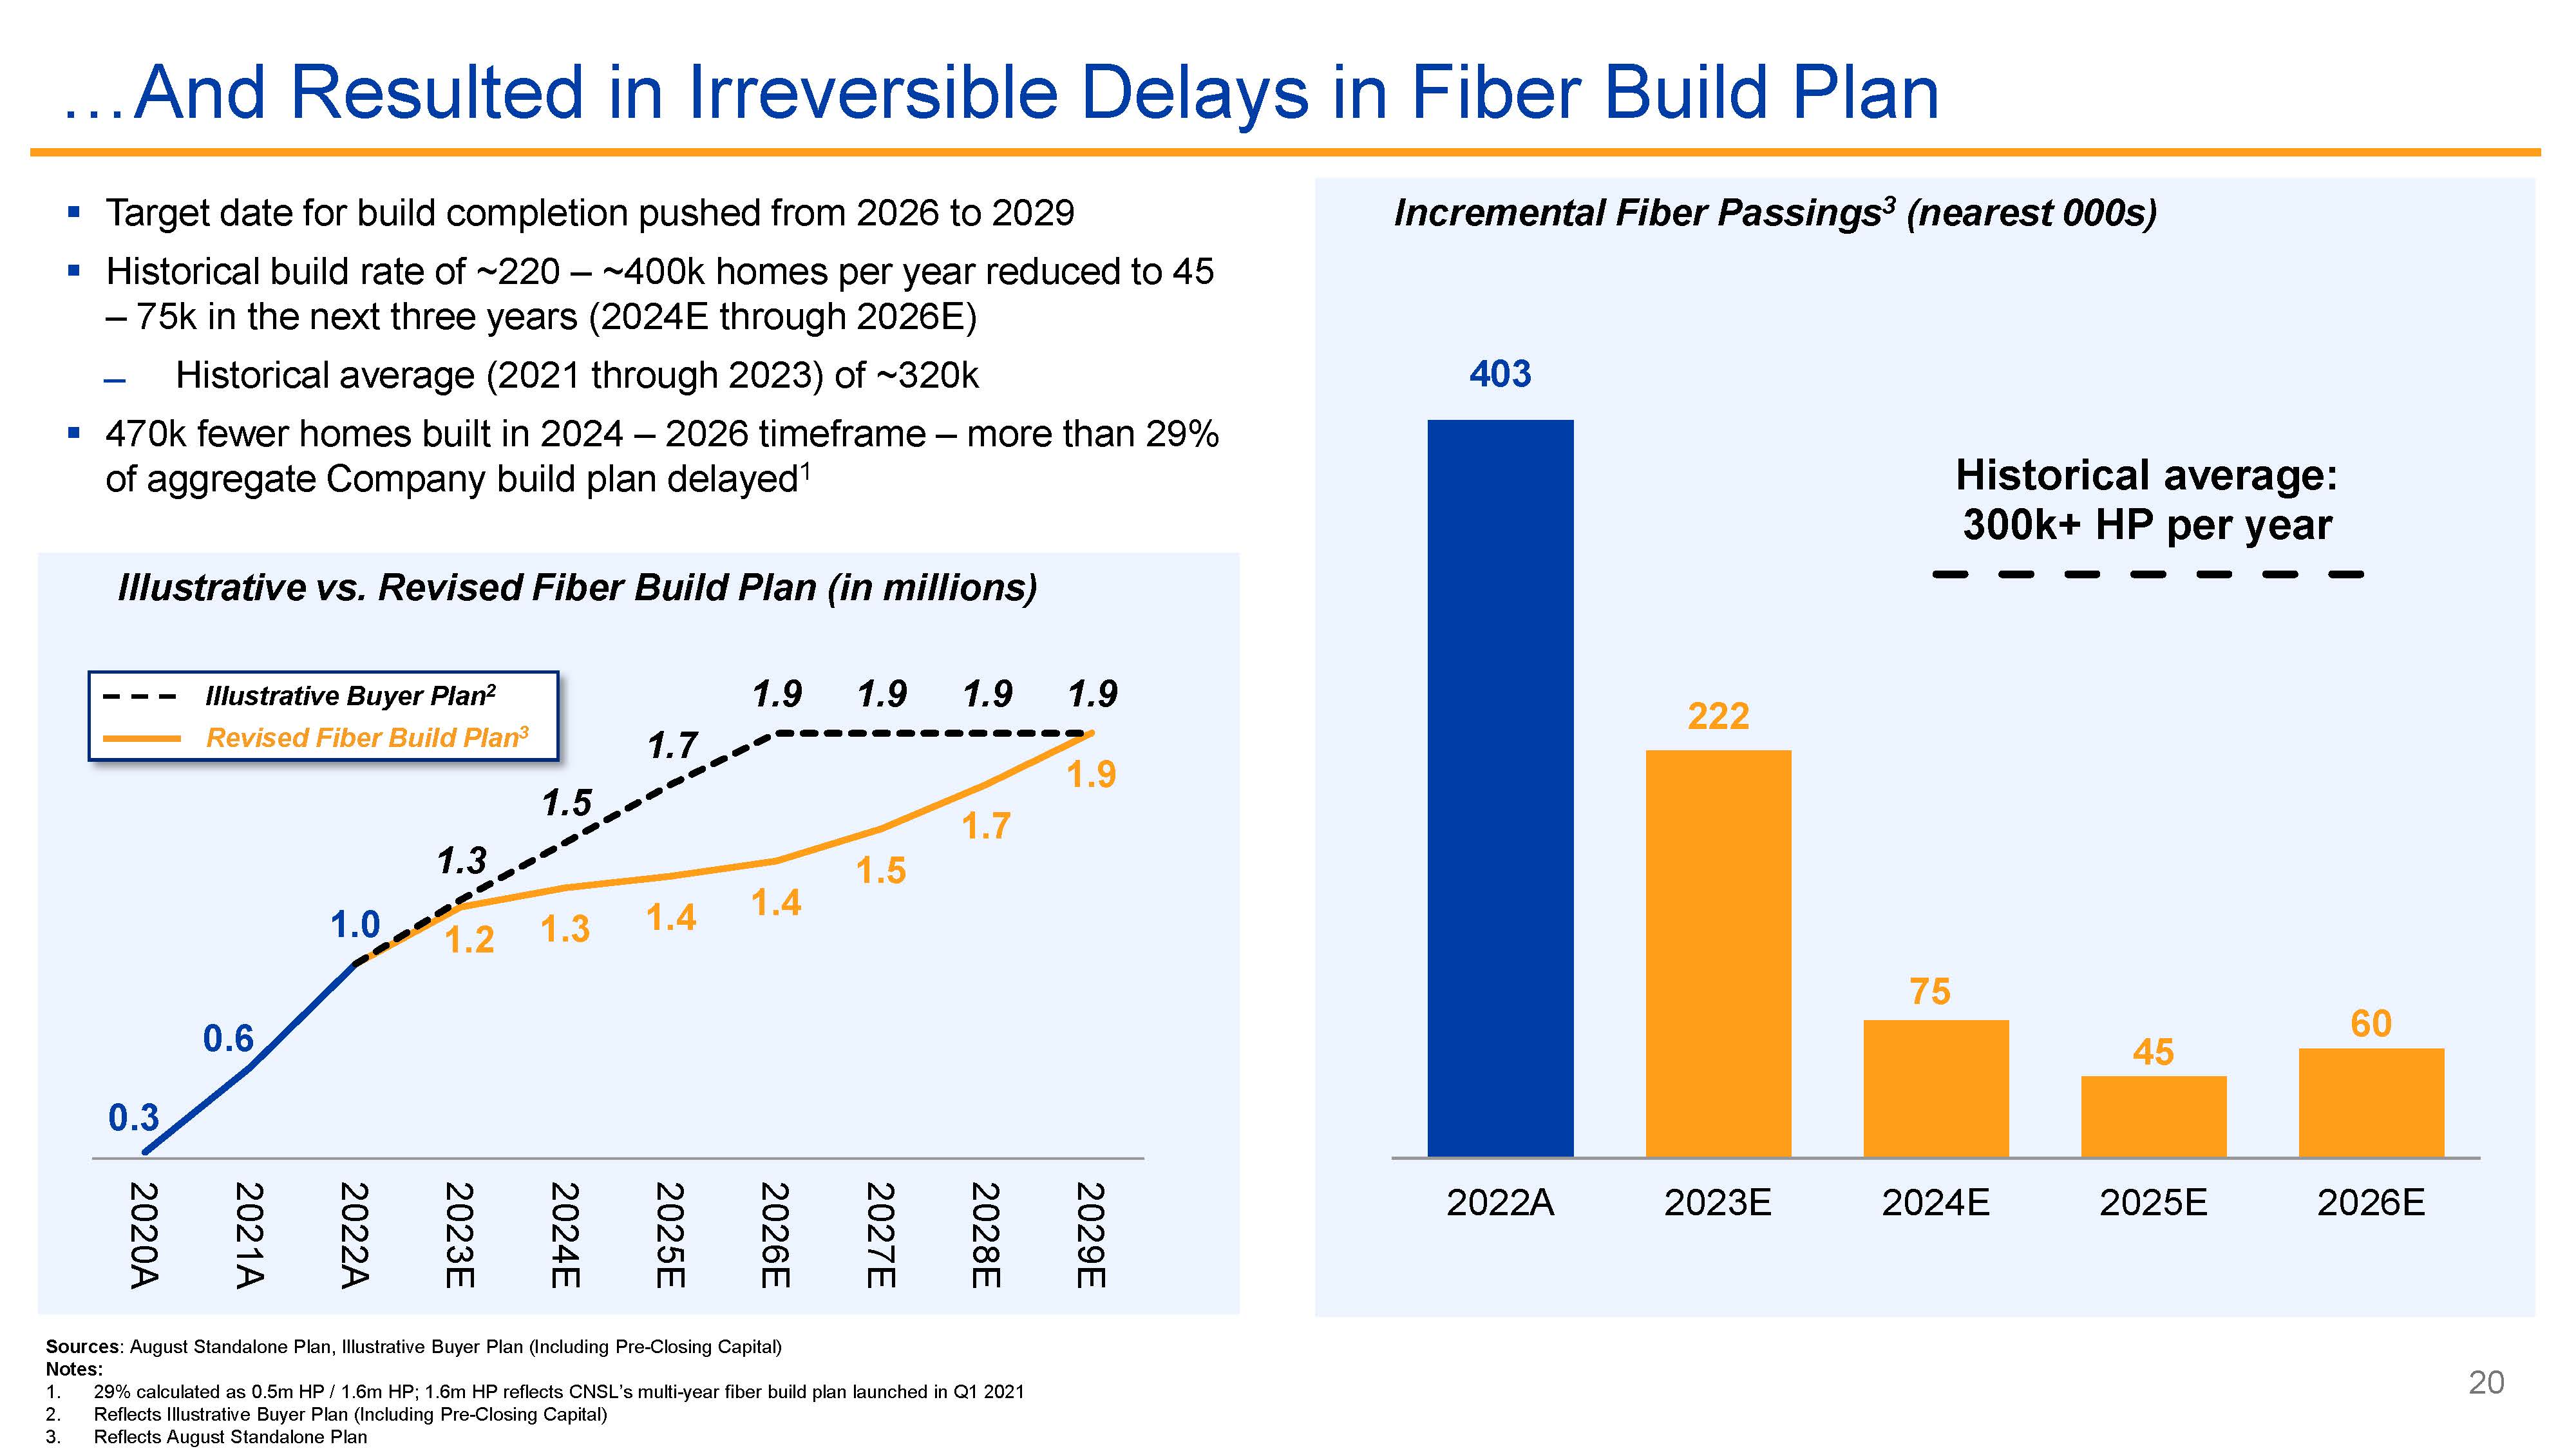
| 403
222
75
45
60
Historical average:
300k+ HP per year
2022A 2023E 2024E 2025E 2026E
1.2 1.3 1.4 1.4
1.5
1.7
1.9
0.3
0.6
1.0
1.3
1.5
1.7
1.9 1.9 1.9 1.9
2020A
2021A
2022A
2023E
2024E
2025E
2026E
2027E
2028E
2029E
20
…And Resulted in Irreversible Delays in Fiber Build Plan
Sources: August Standalone Plan, Illustrative Buyer Plan (Including Pre-Closing Capital)
Notes:
1. 29% calculated as 0.5m HP / 1.6m HP; 1.6m HP reflects CNSL’s multi-year fiber build plan launched in Q1 2021
2. Reflects Illustrative Buyer Plan (Including Pre-Closing Capital)
3. Reflects August Standalone Plan
▪ Target date for build completion pushed from 2026 to 2029
▪ Historical build rate of ~220 – ~400k homes per year reduced to 45
– 75k in the next three years (2024E through 2026E)
̶ Historical average (2021 through 2023) of ~320k
▪ 470k fewer homes built in 2024 – 2026 timeframe – more than 29%
of aggregate Company build plan delayed1
Incremental Fiber Passings2
(nearest 000s)
Illustrative vs. Revised Fiber Build Plan (in millions)
Illustrative Buyer Plan2
Revised Fiber Build Plan3 |
| 21
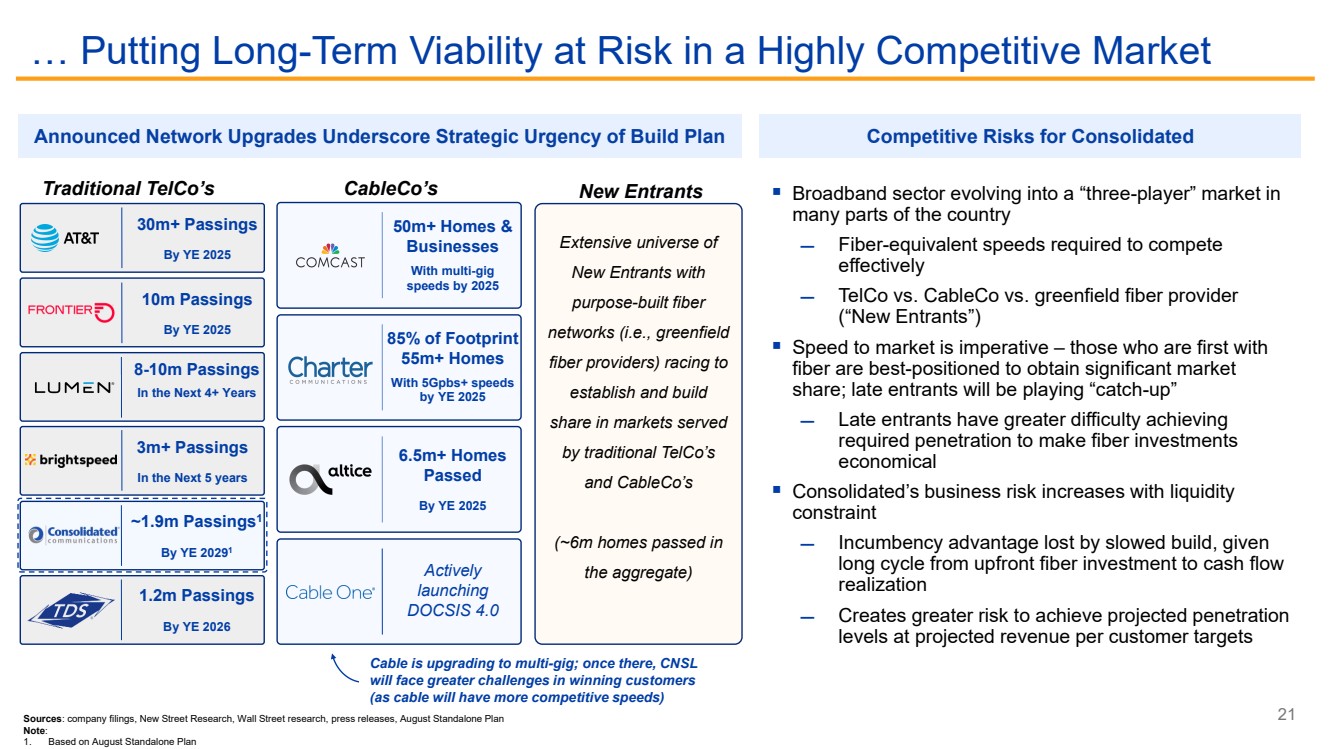
… Putting Long-Term Viability at Risk in a Highly Competitive Market
Announced Network Upgrades Underscore Strategic Urgency of Build Plan Competitive Risks for Consolidated
▪ Broadband sector evolving into a “three-player” market in
many parts of the country
̶ Fiber-equivalent speeds required to compete
effectively
̶ TelCo vs. CableCo vs. greenfield fiber provider
(“New Entrants”)
▪ Speed to market is imperative – those who are first with
fiber are best-positioned to obtain significant market
share; late entrants will be playing “catch-up”
̶ Late entrants have greater difficulty achieving
required penetration to make fiber investments
economical
▪ Consolidated’s business risk increases with liquidity
constraint
̶ Incumbency advantage lost by slowed build, given
long cycle from upfront fiber investment to cash flow
realization
̶ Creates greater risk to achieve projected penetration
levels at projected revenue per customer targets
30m+ Passings
By YE 2025
1.2m Passings
By YE 2026
10m Passings
By YE 2025
8-10m Passings
In the Next 4+ Years
~1.9m Passings1
By YE 20291
Extensive universe of
New Entrants with
purpose-built fiber
networks (i.e., greenfield
fiber providers) racing to
establish and build
share in markets served
by traditional TelCo’s
and CableCo’s
(~6m homes passed in
Actively the aggregate)
launching
DOCSIS 4.0
50m+ Homes &
Businesses
With multi-gig
speeds by 2025
6.5m+ Homes
Passed
By YE 2025
85% of Footprint
55m+ Homes
With 5Gpbs+ speeds
by YE 2025
3m+ Passings
In the Next 5 years
Traditional TelCo’s CableCo’s New Entrants
Cable is upgrading to multi-gig; once there, CNSL
will face greater challenges in winning customers
(as cable will have more competitive speeds)
Sources: company filings, New Street Research, Wall Street research, press releases, August Standalone Plan
Note:
1. Based on August Standalone Plan |
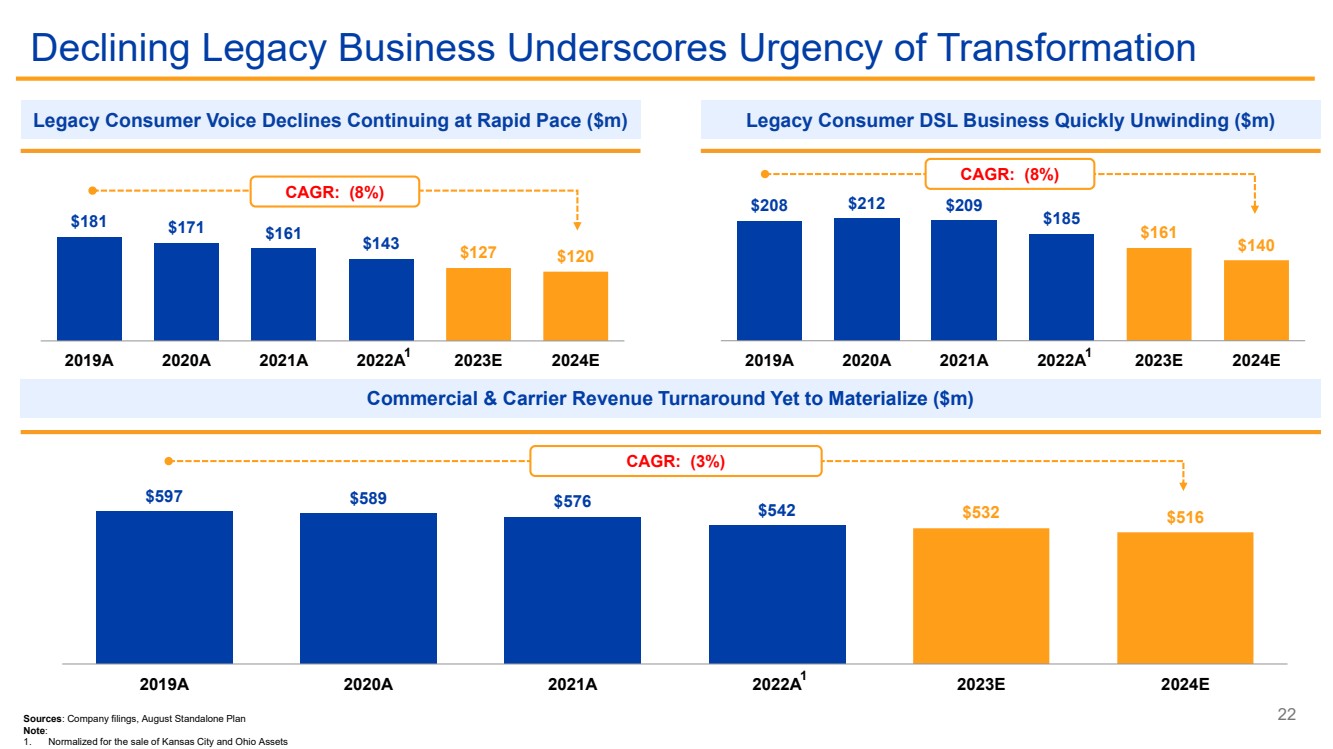
| $597 $589 $576 $542 $532 $516
2019A 2020A 2021A 2022A 2023E 2024E
Chart Title
$208 $212 $209
$185
$161 $140
2019A 2020A 2021A 2022A 2023E 2024E
Chart Title
$181 $171 $161 $143 $127 $120
2019A 2020A 2021A 2022A 2023E 2024E
Chart Title
Legacy Consumer DSL Business Quickly Unwinding ($m)
22
Declining Legacy Business Underscores Urgency of Transformation
Sources: Company filings, August Standalone Plan
Note:
1. Normalized for the sale of Kansas City and Ohio Assets
CAGR: (8%)
CAGR: (3%)
Legacy Consumer Voice Declines Continuing at Rapid Pace ($m)
Commercial & Carrier Revenue Turnaround Yet to Materialize ($m)
CAGR: (8%)
1 1
1 |
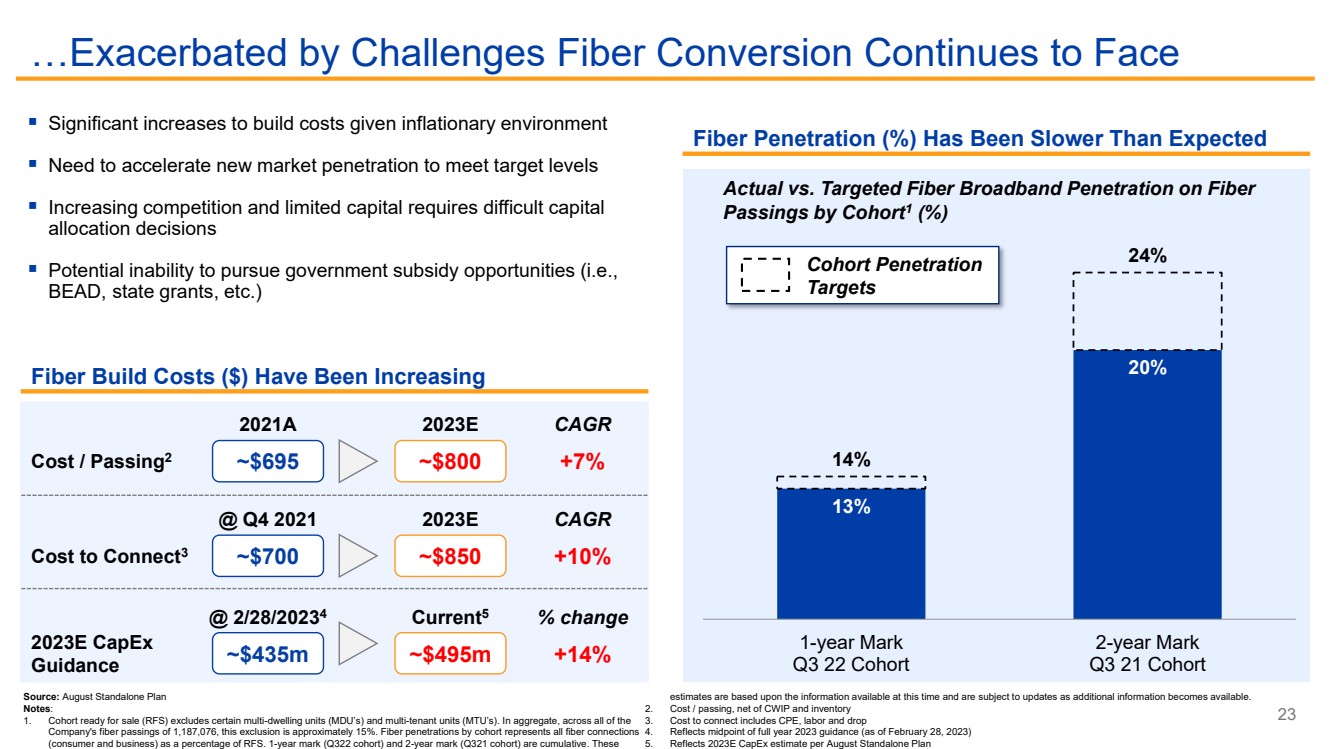
| 13%
20%
14%
24%
1-year Mark
Q3 22 Cohort
2-year Mark
Q3 21 Cohort
Chart Title
23
…Exacerbated by Challenges Fiber Conversion Continues to Face
Source: August Standalone Plan
Notes:
1. Cohort ready for sale (RFS) excludes certain multi-dwelling units (MDU’s) and multi-tenant units (MTU’s). In aggregate, across all of the
Company's fiber passings of 1,187,076, this exclusion is approximately 15%. Fiber penetrations by cohort represents all fiber connections
(consumer and business) as a percentage of RFS. 1-year mark (Q322 cohort) and 2-year mark (Q321 cohort) are cumulative. These
estimates are based upon the information available at this time and are subject to updates as additional information becomes available.
2. Cost / passing, net of CWIP and inventory
3. Cost to connect includes CPE, labor and drop
4. Reflects midpoint of full year 2023 guidance (as of February 28, 2023)
5. Reflects 2023E CapEx estimate per August Standalone Plan
▪ Significant increases to build costs given inflationary environment
▪ Need to accelerate new market penetration to meet target levels
▪ Increasing competition and limited capital requires difficult capital
allocation decisions
▪ Potential inability to pursue government subsidy opportunities (i.e.,
BEAD, state grants, etc.)
Fiber Penetration (%) Has Been Slower Than Expected
Fiber Build Costs ($) Have Been Increasing
~$435m 2023E CapEx
Guidance ~$495m
@ 2/28/20234 Current5
Actual vs. Targeted Fiber Broadband Penetration on Fiber
Passings by Cohort1
(%)
Cohort Penetration
Targets
Cost / Passing ~$695 2 ~$800
2021A 2023E
+7%
CAGR
+14%
% change
Cost to Connect ~$700 3 ~$850
@ Q4 2021 2023E
+10%
CAGR |
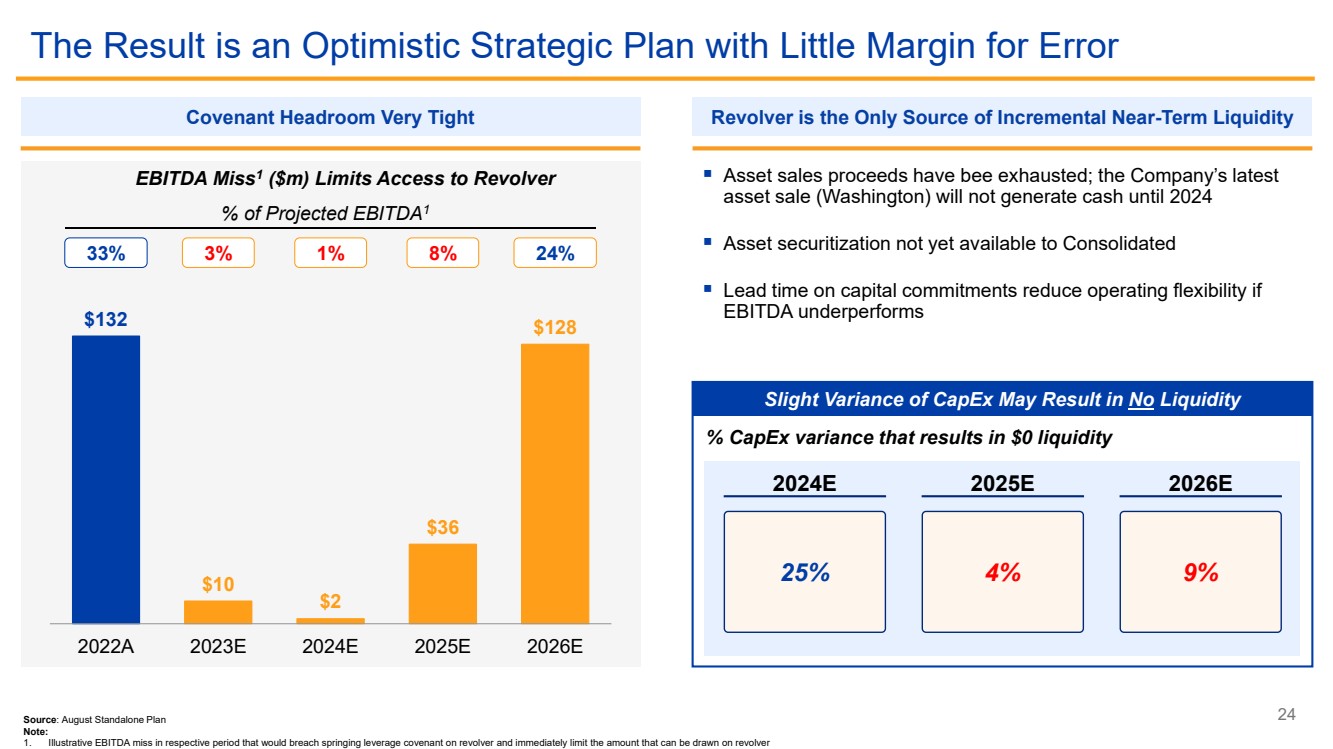
| $132
$10
$2
$36
$128
33% 3% 1% 8% 24%
2022A 2023E 2024E 2025E 2026E
24
The Result is an Optimistic Strategic Plan with Little Margin for Error
Source: August Standalone Plan
Note:
1. Illustrative EBITDA miss in respective period that would breach springing leverage covenant on revolver and immediately limit the amount that can be drawn on revolver
Covenant Headroom Very Tight Revolver is the Only Source of Incremental Near-Term Liquidity
EBITDA Miss1
($m) Limits Access to Revolver
% of Projected EBITDA1
▪ Asset sales proceeds have bee exhausted; the Company’s latest
asset sale (Washington) will not generate cash until 2024
▪ Asset securitization not yet available to Consolidated
▪ Lead time on capital commitments reduce operating flexibility if
EBITDA underperforms
Slight Variance of CapEx May Result in No Liquidity
% CapEx variance that results in $0 liquidity
2024E 2025E 2026E
25% 4% 9% |
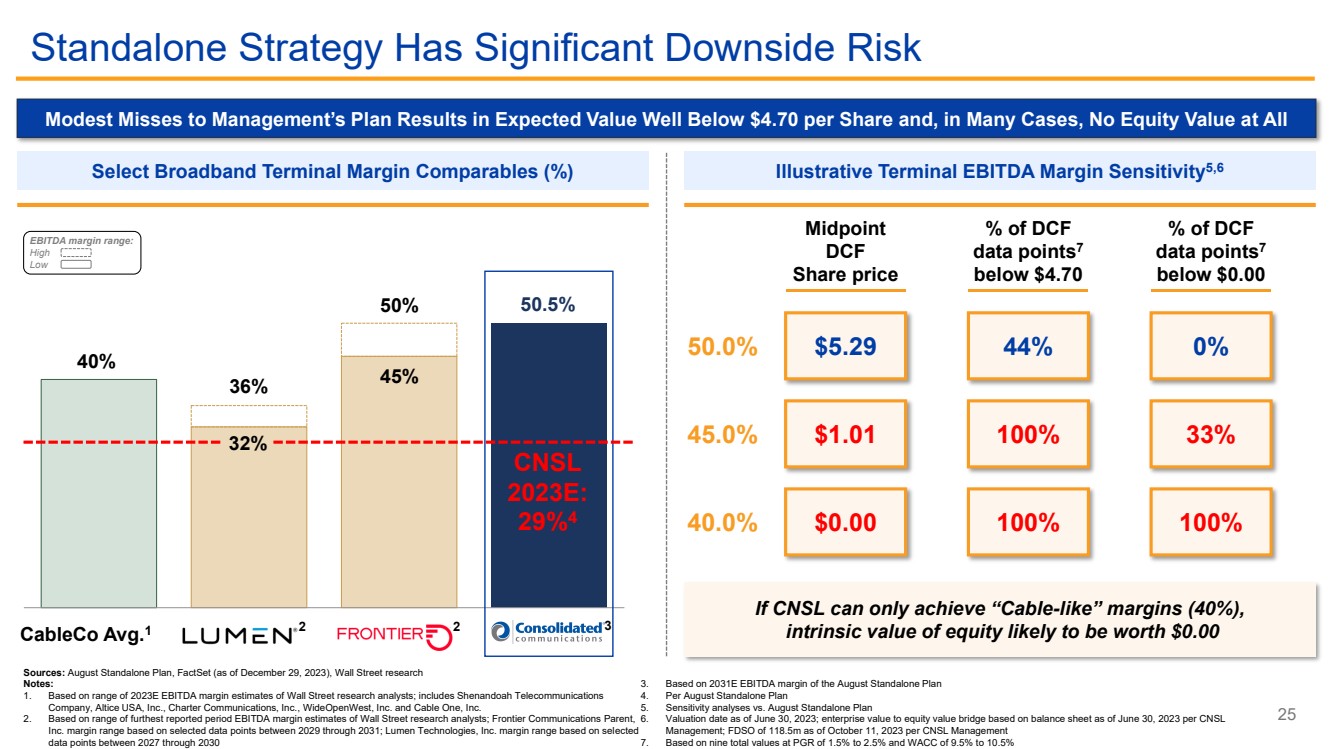
| 40%
36%
50% 50.5%
32%
45%
25
Standalone Strategy Has Significant Downside Risk
Sources: August Standalone Plan, FactSet (as of December 29, 2023), Wall Street research
Notes:
1. Based on range of 2023E EBITDA margin estimates of Wall Street research analysts; includes Shenandoah Telecommunications
Company, Altice USA, Inc., Charter Communications, Inc., WideOpenWest, Inc. and Cable One, Inc.
2. Based on range of furthest reported period EBITDA margin estimates of Wall Street research analysts; Frontier Communications Parent,
Inc. margin range based on selected data points between 2029 through 2031; Lumen Technologies, Inc. margin range based on selected
data points between 2027 through 2030
3. Based on 2031E EBITDA margin of the August Standalone Plan
4. Per August Standalone Plan
5. Sensitivity analyses vs. August Standalone Plan
6. Valuation date as of June 30, 2023; enterprise value to equity value bridge based on balance sheet as of June 30, 2023 per CNSL
Management; FDSO of 118.5m as of October 11, 2023 per CNSL Management
7. Based on nine total values at PGR of 1.5% to 2.5% and WACC of 9.5% to 10.5%
Modest Misses to Management’s Plan Results in Expected Value Well Below $4.70 per Share and, in Many Cases, No Equity Value at All
Select Broadband Terminal Margin Comparables (%) Illustrative Terminal EBITDA Margin Sensitivity5,6
CableCo Avg.1
50.0% $5.29 44% 0%
45.0% $1.01 100% 33%
40.0% $0.00 100% 100%
% of DCF
data points7
below $0.00
Midpoint
DCF
Share price
% of DCF
data points7
below $4.70
2 2 3
EBITDA margin range:
High
Low
CNSL
2023E:
29%4
If CNSL can only achieve “Cable-like” margins (40%),
intrinsic value of equity likely to be worth $0.00
32% |
| 26
Following Wildcat’s Lead Would Be Disastrous For Shareholders |
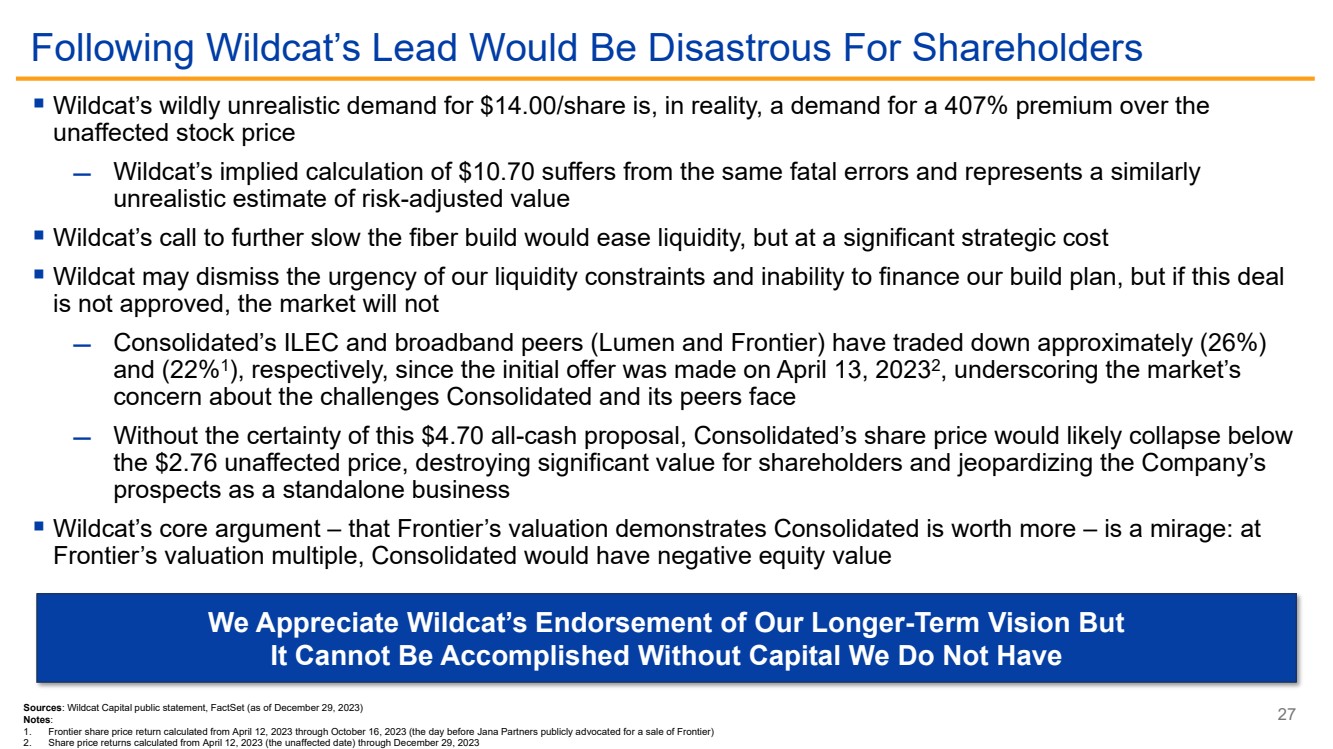
| 27
▪ Wildcat’s wildly unrealistic demand for $14.00/share is, in reality, a demand for a 407% premium over the
unaffected stock price
̶ Wildcat’s implied calculation of $10.70 suffers from the same fatal errors and represents a similarly
unrealistic estimate of risk-adjusted value
▪ Wildcat’s call to further slow the fiber build would ease liquidity, but at a significant strategic cost
▪ Wildcat may dismiss the urgency of our liquidity constraints and inability to finance our build plan, but if this deal
is not approved, the market will not
̶ Consolidated’s ILEC and broadband peers (Lumen and Frontier) have traded down approximately (26%)
and (22%1
), respectively, since the initial offer was made on April 13, 20232
, underscoring the market’s
concern about the challenges Consolidated and its peers face
̶ Without the certainty of this $4.70 all-cash proposal, Consolidated’s share price would likely collapse below
the $2.76 unaffected price, destroying significant value for shareholders and jeopardizing the Company’s
prospects as a standalone business
▪ Wildcat’s core argument – that Frontier’s valuation demonstrates Consolidated is worth more – is a mirage: at
Frontier’s valuation multiple, Consolidated would have negative equity value
Sources: Wildcat Capital public statement, FactSet (as of December 29, 2023)
Notes:
1. Frontier share price return calculated from April 12, 2023 through October 16, 2023 (the day before Jana Partners publicly advocated for a sale of Frontier)
2. Share price returns calculated from April 12, 2023 (the unaffected date) through December 29, 2023
We Appreciate Wildcat’s Endorsement of Our Longer-Term Vision But
It Cannot Be Accomplished Without Capital We Do Not Have
Following Wildcat’s Lead Would Be Disastrous For Shareholders |
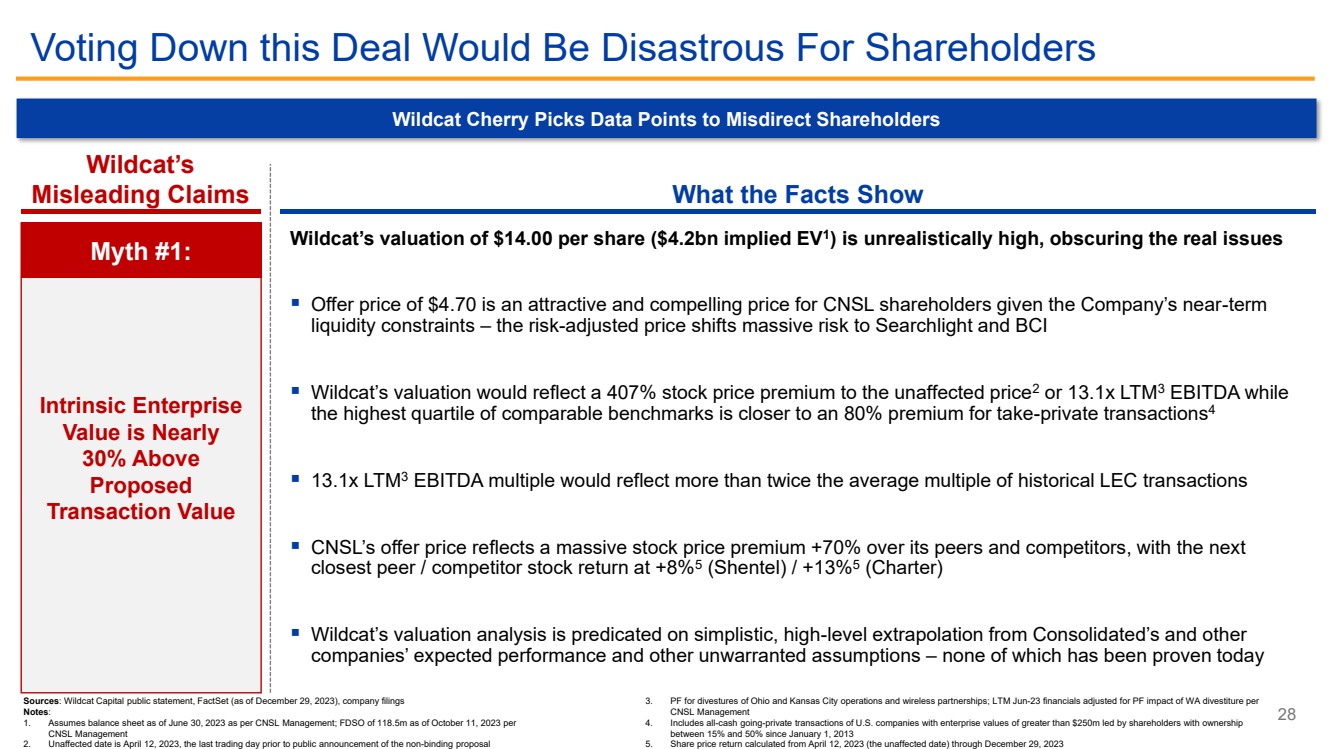
| 28
Sources: Wildcat Capital public statement, FactSet (as of December 29, 2023), company filings
Notes:
1. Assumes balance sheet as of June 30, 2023 as per CNSL Management; FDSO of 118.5m as of October 11, 2023 per
CNSL Management
2. Unaffected date is April 12, 2023, the last trading day prior to public announcement of the non-binding proposal
3. PF for divestures of Ohio and Kansas City operations and wireless partnerships; LTM Jun-23 financials adjusted for PF impact of WA divestiture per
CNSL Management
4. Includes all-cash going-private transactions of U.S. companies with enterprise values of greater than $250m led by shareholders with ownership
between 15% and 50% since January 1, 2013
5. Share price return calculated from April 12, 2023 (the unaffected date) through December 29, 2023
Wildcat Cherry Picks Data Points to Misdirect Shareholders
Wildcat’s
Misleading Claims What the Facts Show
Wildcat’s valuation of $14.00 per share ($4.2bn implied EV1
) is unrealistically high, obscuring the real issues
▪ Offer price of $4.70 is an attractive and compelling price for CNSL shareholders given the Company’s near-term
liquidity constraints – the risk-adjusted price shifts massive risk to Searchlight and BCI
▪ Wildcat’s valuation would reflect a 407% stock price premium to the unaffected price2 or 13.1x LTM3 EBITDA while
the highest quartile of comparable benchmarks is closer to an 80% premium for take-private transactions4
▪ 13.1x LTM3 EBITDA multiple would reflect more than twice the average multiple of historical LEC transactions
▪ CNSL’s offer price reflects a massive stock price premium +70% over its peers and competitors, with the next
closest peer / competitor stock return at +8%5
(Shentel) / +13%5
(Charter)
▪ Wildcat’s valuation analysis is predicated on simplistic, high-level extrapolation from Consolidated’s and other
companies’ expected performance and other unwarranted assumptions – none of which has been proven today
Intrinsic Enterprise
Value is Nearly
30% Above
Proposed
Transaction Value
Myth #1:
Voting Down this Deal Would Be Disastrous For Shareholders |
| Wildcat’s
Misleading Claims
Sources: Wildcat Capital public statement, company filings 29
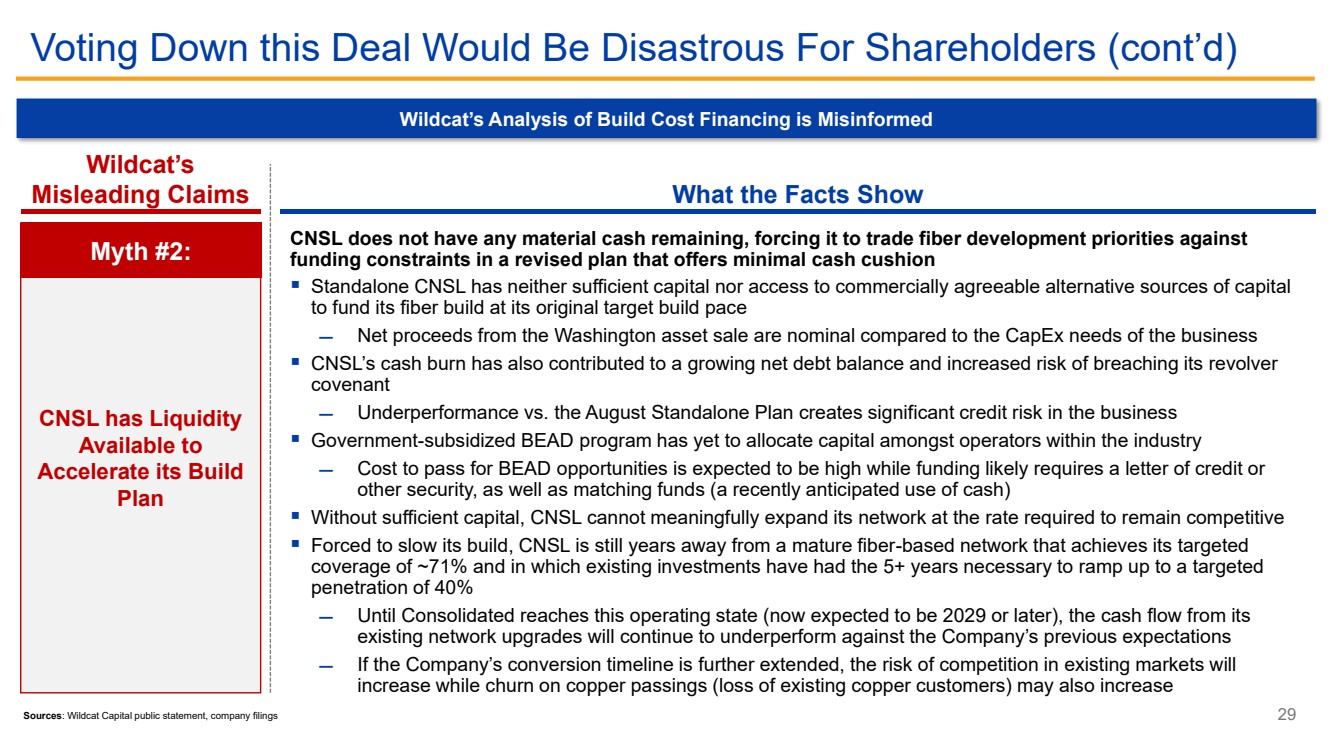
Wildcat’s Analysis of Build Cost Financing is Misinformed
What the Facts Show
CNSL does not have any material cash remaining, forcing it to trade fiber development priorities against
funding constraints in a revised plan that offers minimal cash cushion
▪ Standalone CNSL has neither sufficient capital nor access to commercially agreeable alternative sources of capital
to fund its fiber build at its original target build pace
̶ Net proceeds from the Washington asset sale are nominal compared to the CapEx needs of the business
▪ CNSL’s cash burn has also contributed to a growing net debt balance and increased risk of breaching its revolver
covenant
̶ Underperformance vs. the August Standalone Plan creates significant credit risk in the business
▪ Government-subsidized BEAD program has yet to allocate capital amongst operators within the industry
̶ Cost to pass for BEAD opportunities is expected to be high while funding likely requires a letter of credit or
other security, as well as matching funds (a recently anticipated use of cash)
▪ Without sufficient capital, CNSL cannot meaningfully expand its network at the rate required to remain competitive
▪ Forced to slow its build, CNSL is still years away from a mature fiber-based network that achieves its targeted
coverage of ~71% and in which existing investments have had the 5+ years necessary to ramp up to a targeted
penetration of 40%
̶ Until Consolidated reaches this operating state (now expected to be 2029 or later), the cash flow from its
existing network upgrades will continue to underperform against the Company’s previous expectations
̶ If the Company’s conversion timeline is further extended, the risk of competition in existing markets will
increase while churn on copper passings (loss of existing copper customers) may also increase
CNSL has Liquidity
Available to
Accelerate its Build
Plan
Myth #2:
Voting Down this Deal Would Be Disastrous For Shareholders (cont’d) |
| 30
Sources: Wildcat Capital public statement, company filings, Fitch
Note:
1. Fiber Gig+ Capable (on fiber passings) consumer broadband penetration % as of Q3 2023
2. Per August Standalone Plan
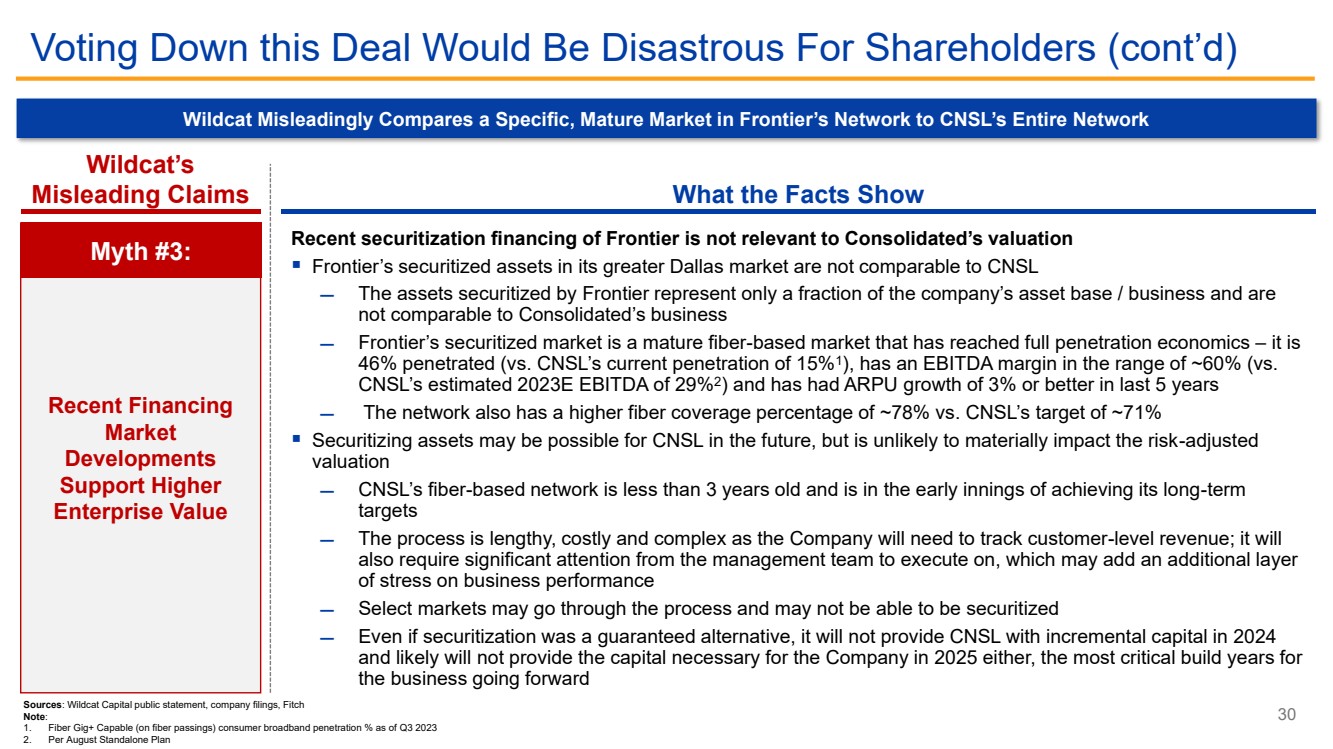
Wildcat Misleadingly Compares a Specific, Mature Market in Frontier’s Network to CNSL’s Entire Network
What the Facts Show
Recent securitization financing of Frontier is not relevant to Consolidated’s valuation
▪ Frontier’s securitized assets in its greater Dallas market are not comparable to CNSL
̶ The assets securitized by Frontier represent only a fraction of the company’s asset base / business and are
not comparable to Consolidated’s business
̶ Frontier’s securitized market is a mature fiber-based market that has reached full penetration economics – it is
46% penetrated (vs. CNSL’s current penetration of 15%1
), has an EBITDA margin in the range of ~60% (vs.
CNSL’s estimated 2023E EBITDA of 29%2
) and has had ARPU growth of 3% or better in last 5 years
̶ The network also has a higher fiber coverage percentage of ~78% vs. CNSL’s target of ~71%
▪ Securitizing assets may be possible for CNSL in the future, but is unlikely to materially impact the risk-adjusted
valuation
̶ CNSL’s fiber-based network is less than 3 years old and is in the early innings of achieving its long-term
targets
̶ The process is lengthy, costly and complex as the Company will need to track customer-level revenue; it will
also require significant attention from the management team to execute on, which may add an additional layer
of stress on business performance
̶ Select markets may go through the process and may not be able to be securitized
̶ Even if securitization was a guaranteed alternative, it will not provide CNSL with incremental capital in 2024
and likely will not provide the capital necessary for the Company in 2025 either, the most critical build years for
the business going forward
Recent Financing
Market
Developments
Support Higher
Enterprise Value
Myth #3:
Voting Down this Deal Would Be Disastrous For Shareholders (cont’d)
Wildcat’s
Misleading Claims |
| 31
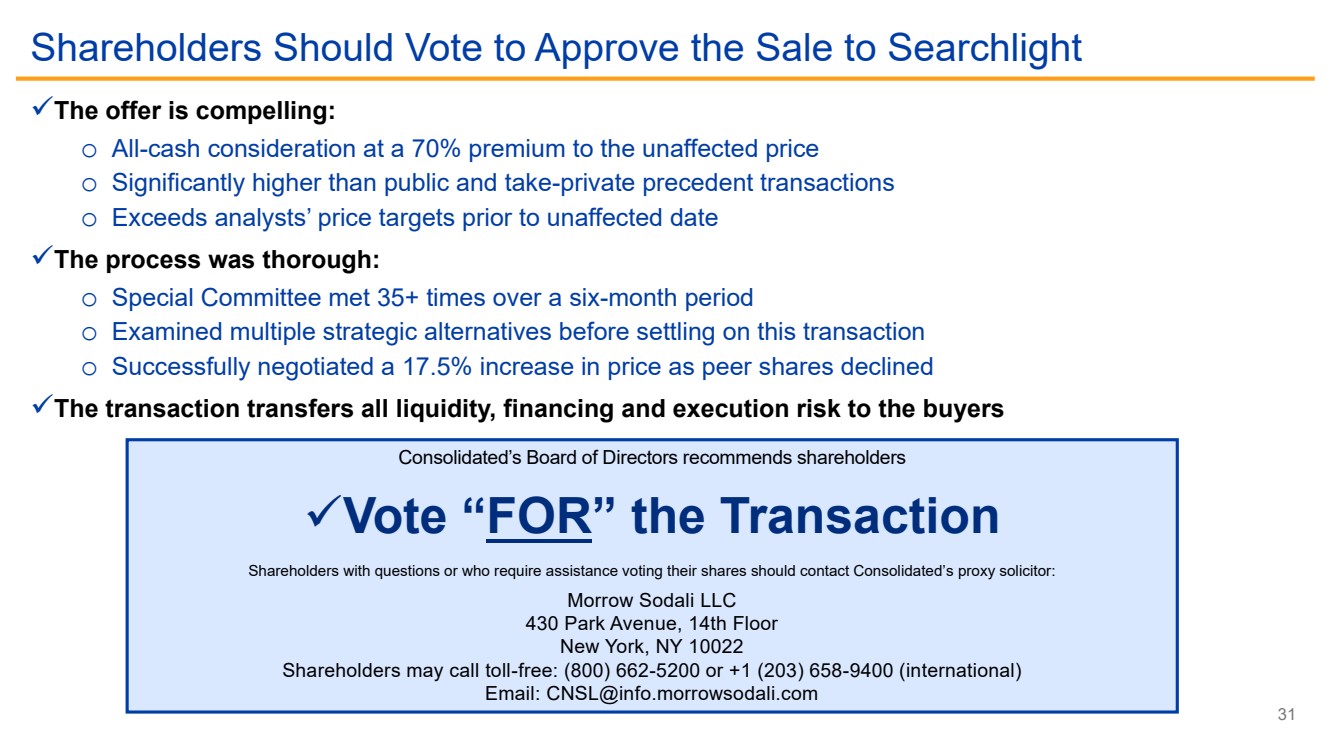
Shareholders Should Vote to Approve the Sale to Searchlight
✓The offer is compelling:
o All-cash consideration at a 70% premium to the unaffected price
o Significantly higher than public and take-private precedent transactions
o Exceeds analysts’ price targets prior to unaffected date
✓The process was thorough:
o Special Committee met 35+ times over a six-month period
o Examined multiple strategic alternatives before settling on this transaction
o Successfully negotiated a 17.5% increase in price as peer shares declined
✓The transaction transfers all liquidity, financing and execution risk to the buyers
Consolidated’s Board of Directors recommends shareholders
✓Vote “FOR” the Transaction
Shareholders with questions or who require assistance voting their shares should contact Consolidated’s proxy solicitor:
Morrow Sodali LLC
430 Park Avenue, 14th Floor
New York, NY 10022
Shareholders may call toll-free: (800) 662-5200 or +1 (203) 658-9400 (international)
Email: CNSL@info.morrowsodali.com |

| 32
Appendix |
| 33
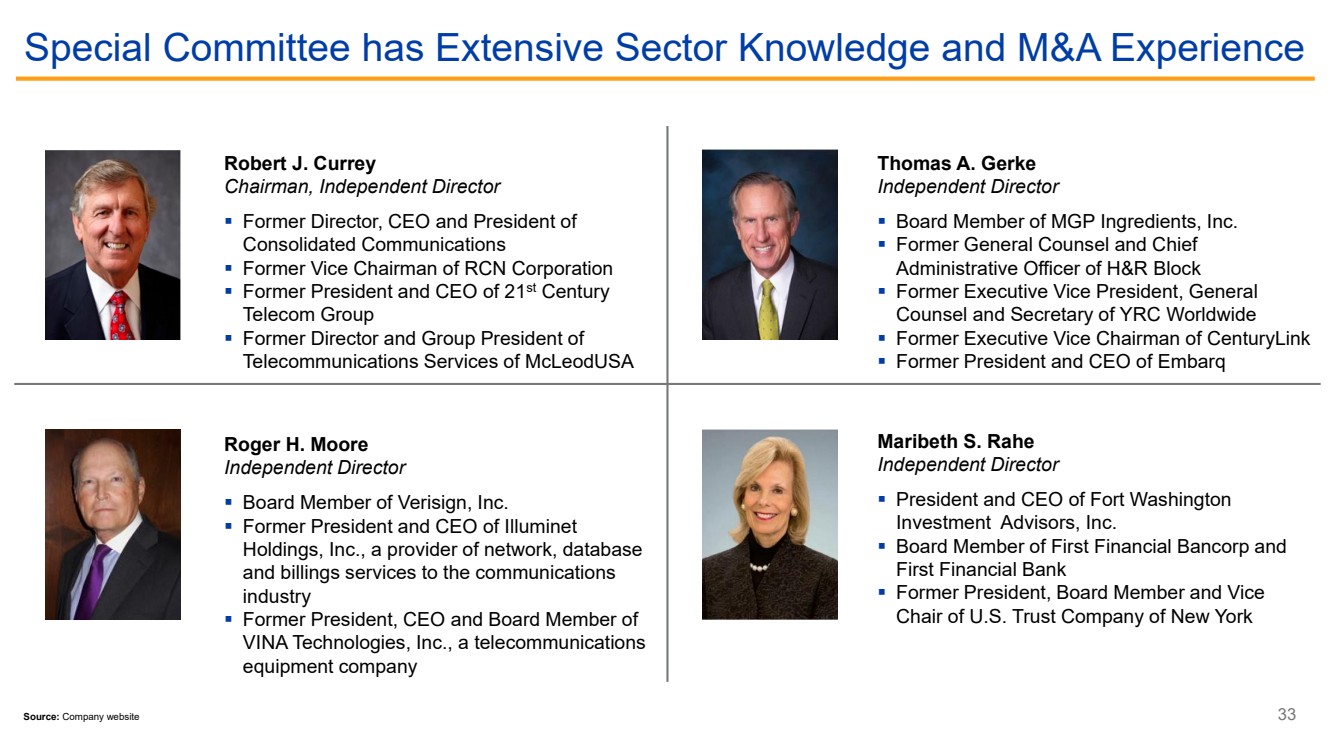
Special Committee has Extensive Sector Knowledge and M&A Experience
Robert J. Currey
Chairman, Independent Director
▪ Former Director, CEO and President of
Consolidated Communications
▪ Former Vice Chairman of RCN Corporation
▪ Former President and CEO of 21st Century
Telecom Group
▪ Former Director and Group President of
Telecommunications Services of McLeodUSA
Thomas A. Gerke
Independent Director
▪ Board Member of MGP Ingredients, Inc.
▪ Former General Counsel and Chief
Administrative Officer of H&R Block
▪ Former Executive Vice President, General
Counsel and Secretary of YRC Worldwide
▪ Former Executive Vice Chairman of CenturyLink
▪ Former President and CEO of Embarq
Roger H. Moore
Independent Director
▪ Board Member of Verisign, Inc.
▪ Former President and CEO of Illuminet
Holdings, Inc., a provider of network, database
and billings services to the communications
industry
▪ Former President, CEO and Board Member of
VINA Technologies, Inc., a telecommunications
equipment company
Maribeth S. Rahe
Independent Director
▪ President and CEO of Fort Washington
Investment Advisors, Inc.
▪ Board Member of First Financial Bancorp and
First Financial Bank
▪ Former President, Board Member and Vice
Chair of U.S. Trust Company of New York
Source: Company website |
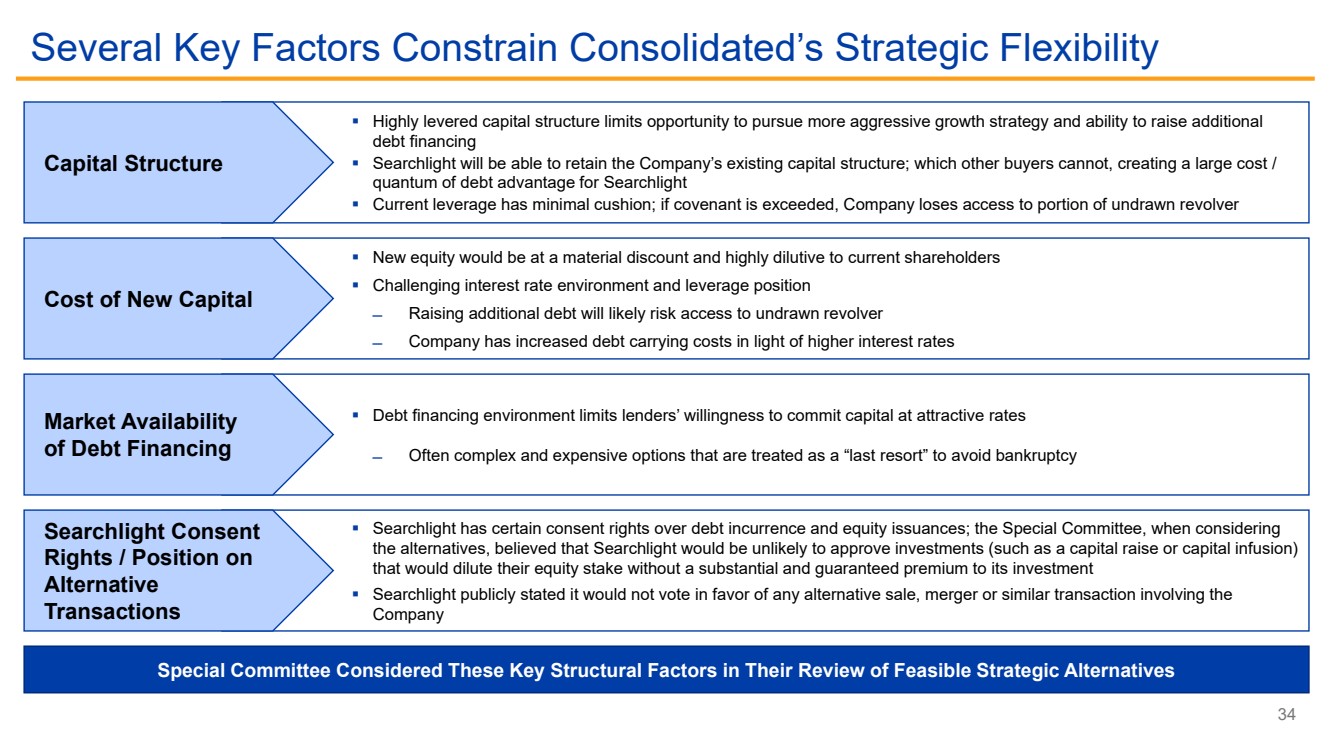
| 34
Several Key Factors Constrain Consolidated’s Strategic Flexibility
▪ Searchlight has certain consent rights over debt incurrence and equity issuances; the Special Committee, when considering
the alternatives, believed that Searchlight would be unlikely to approve investments (such as a capital raise or capital infusion)
that would dilute their equity stake without a substantial and guaranteed premium to its investment
▪ Searchlight publicly stated it would not vote in favor of any alternative sale, merger or similar transaction involving the
Company
Searchlight Consent
Rights / Position on
Alternative
Transactions
▪ New equity would be at a material discount and highly dilutive to current shareholders
▪ Challenging interest rate environment and leverage position
̶ Raising additional debt will likely risk access to undrawn revolver
̶ Company has increased debt carrying costs in light of higher interest rates
Cost of New Capital
▪ Debt financing environment limits lenders’ willingness to commit capital at attractive rates
̶ Often complex and expensive options that are treated as a “last resort” to avoid bankruptcy
Market Availability
of Debt Financing
▪ Highly levered capital structure limits opportunity to pursue more aggressive growth strategy and ability to raise additional
debt financing
▪ Searchlight will be able to retain the Company’s existing capital structure; which other buyers cannot, creating a large cost /
quantum of debt advantage for Searchlight
▪ Current leverage has minimal cushion; if covenant is exceeded, Company loses access to portion of undrawn revolver
Capital Structure
Special Committee Considered These Key Structural Factors in Their Review of Feasible Strategic Alternatives |
Consolidated Communicati... (NASDAQ:CNSL)
Historical Stock Chart
From Apr 2024 to May 2024

Consolidated Communicati... (NASDAQ:CNSL)
Historical Stock Chart
From May 2023 to May 2024
