PROVIDENT FINANCIAL SERVICES INC false 0001178970 0001178970 2024-05-06 2024-05-06
UNITED STATES
SECURITIES AND EXCHANGE COMMISSION
Washington, D.C. 20549
FORM 8-K
CURRENT REPORT
PURSUANT TO SECTION 13 OR 15(d)
OF THE SECURITIES EXCHANGE ACT OF 1934
Date of report (Date of earliest event reported): May 6, 2024
PROVIDENT FINANCIAL SERVICES, INC.
(Exact name of registrant as specified in its charter)
|
|
|
|
|
| Delaware |
|
001-31566 |
|
42-1547151 |
(State or other jurisdiction
of incorporation) |
|
(Commission File Number) |
|
(IRS Employer
Identification No.) |
239 Washington Street, Jersey City, New Jersey 07302
(Address of principal executive offices) (Zip Code)
(732) 590-9200
(Registrant’s telephone number, including area code)
Not Applicable
(Former name or former address, if changed since last report)
Check the appropriate box below if the Form 8-K filing is intended to simultaneously satisfy the filing obligation of the registrant under any of the following provisions:
| ☐ |
Written communications pursuant to Rule 425 under the Securities Act (17 CFR 230.425) |
| ☐ |
Soliciting material pursuant to Rule 14a-12 under the Exchange Act (17 CFR 240.14a-12) |
| ☐ |
Pre-commencement communications pursuant to Rule 14d-2(b) under the Exchange Act (17 CFR 240.14d-2(b)) |
| ☐ |
Pre-commencement communications pursuant to Rule 13e-4 (c) under the Exchange Act (17 CFR 240.13e-4(c)) |
Securities registered pursuant to Section 12(b) of the Act:
|
|
|
|
|
| Title of each class |
|
Trading
Symbol(s) |
|
Name of each exchange on which registered |
| Common stock, par value $0.01 per share |
|
PFS |
|
New York Stock Exchange |
Indicate by check mark whether the registrant is an emerging growth company as defined in Rule 405 of the Securities Act of 1933 (§230.405 of this chapter) or Rule 12b-2 of the Securities Exchange Act of 1934 (§240.12b-2 of this chapter).
Emerging growth company ☐
If an emerging growth company, indicate by check mark if the registrant has elected not to use the extended transition period for complying with any new or revised financial accounting standards provided pursuant to Section 13(a) of the Exchange Act. ☐
| Item 7.01. |
Regulation FD Disclosure. |
On May 6, 2024, Provident Financial Services, Inc. (the “Company”), parent company of Provident Bank, made available and distributed to analysts and prospective investors a slide presentation. The presentation materials include information regarding the Company’s transaction with Lakeland Bancorp, Inc., operating and growth strategies and financial performance. The slide presentation is furnished in this Current Report on Form 8-K, pursuant to this Item 7.01, as Exhibit 99.1, and is incorporated herein by reference.
This Current Report and the information included below and furnished as exhibits hereto shall not be deemed to be “filed” for purposes of Section 18 of the Securities Exchange Act of 1934, as amended (“Exchange Act”), nor shall it be incorporated by reference into a filing under the Securities Act of 1933, as amended, or the Exchange Act, except as expressly set forth by specific reference in such a filing. The furnishing of the information in this Current Report is not intended to, and does not, constitute a determination or admission by the Company that the information in this report is material or complete, or that investors should consider this information before making an investment decision with respect to any security of the Company or any of its affiliates.
| Item 9.01. |
Financial Statements and Exhibits. |
SIGNATURE
Pursuant to the requirements of the Securities Exchange Act of 1934, as amended, the Company has duly caused this report to be signed on its behalf by the undersigned hereunto duly authorized.
|
|
|
| Provident Financial Services, Inc. |
|
|
| By: |
|
/s/ Thomas M. Lyons |
| Name: |
|
Thomas M. Lyons |
| Title: |
|
Senior Executive Vice President and Chief Financial Officer |
Date: May 6, 2024

Exhibit 99.1 Investor Presentation May 2024
DISCLOSURES ForwardLookingStatements Certain statements contained herein
are “forward‐looking statements” within the meaning of the Private Securities Litigation Reform Act of 1995, Section 27A of the Securities Act of 1933, as amended, and Section 21E of the Securities Exchange Act of 1934, as amended.
Such forward‐looking statements relate to expectations, beliefs, projections, future plans and strategies, anticipated events or trends and similar expressions concerning matters that are not historical facts, including but not limited to
information related to the business combination transaction involving Provident Financial Services, Inc. (the “Company”) and Lakeland Bancorp, Inc. (“Lakeland”) and statements about the proposed securities offering. These
statements may be identified by reference to a future period or periods, or by the use of forward‐looking terminology, such as “may,” “will,” “believe,” “expect,” “estimate,” project,
intend, “anticipate,” “continue,” or similar terms or variations on thoseterms,orthenegativeofthoseterms,includingreferencestoassumptions. The forward‐looking statements contained in this presentation reflect our
current views about future events and financial performance and are subject to risks, uncertainties, assumptions and changes in circumstances that may cause our actual results to differ significantly from historical results and those expressed in
any forward‐looking statement. Some factors that could cause actual results to differ materially from historical or expected results include, but are not limited to, those set forth in Item 1A of the Company's Annual Report on Form 10‐K,
as may be supplemented by its Quarterly Reports on Form 10‐Q and Current Reports on Form 8‐K, and those related to the economic environment, particularly in the market areas in which the Company operates, inflation and unemployment,
competitive products and pricing, real estate values, fiscal and monetary policies of the U.S. Government, changes in accounting policies and practices that may be adopted by the regulatory agencies and the accounting standards setters, changes in
government regulations affecting financial institutions, including regulatory fees and capital requirements, changes in prevailing interestrates,acquisitionsandtheintegrationof
acquiredbusinesses,creditriskmanagement,asset‐liabilitymanagement,thefinancialandsecuritiesmarkets,theavailability ofandcostsassociated with sources of liquidity, the possibility that the proposed transaction between the Company and Lakeland
does not close when expected or at all, the failure to satisfy any conditions of final regulatory approvalsorsatisfyother conditionstoclosingonatimely basisor atall; any failuretorealizetheanticipatedbenefitsofthetransactionwhenexpectedor
atall;certainrestrictionsduring the pendency of the transaction that may impact the Company’s ability to pursue certain business opportunities or strategic transactions; the possibility that the transaction may be more expensive to
complete than anticipated, including as a result of unexpected factors or events; the ability to promptly and effectively integrate the businesses of the Company and Lakeland, diversion of management’s attention from ongoing business
operations and opportunities; potential adverse reactions or changes to business, employee, customer and/or counterparty relationships, including thoseresultingfromthecompletionofthemergerandintegrationofthecompanies. The Company cautions readers
not to place undue reliance on any such forward‐looking statements which speak only as of the date theyaremade.TheCompanyadvisesreadersthatthefactors listed above could affect the Company's financial performance and could cause the Company's
actual results for future periods to differ materially from any opinions or statements expressed with respect to future periods in any current statements. The Company does not assume and expressly disclaims any duty, and does not undertake, to
update anyforward‐looking statements in this presentationtoreflecteventsorcircumstancesafterthedateofthisstatementorotherwise. 2
DISCLOSURES(CONTINUED) NoOfferorSolicitation This presentation is
neither an offer to sell nor a solicitation of an offer topurchaseanysecuritiesoftheCompanyorLakeland.Therewillbenosaleof securities in any jurisdiction in which such an offer, solicitation or sale would be unlawful prior to registration or
qualification under the securities laws of any such jurisdiction. Any securities of the Company to be offered will be issued pursuant
totheCompany’seffectiveshelfregistrationonFormS‐3(FileNo.333‐275213),filedwiththeSecuritiesandExchangeCommission(the SEC ).Beforeconsideringaninvestment,youshouldreadthe prospectusin thatregistration statementand thepreliminary
prospectus supplementandother documentsthatthe Company will file with theSEC for additionalinformation aboutthe Companyand the offering. You may obtain these documents and other documents to be filed with the SEC for free by visiting the SEC’s
website at www.sec.gov. Alternatively, a copy of the prospectus and when available, the preliminary prospectus supplement, may be requested by calling the Company at 732‐590‐9300 or by contacting: Piper Sandler & Co. by email at
fsg‐dcm@psc.com, or by emailing Keefe, Bruyette&WoodsatUSCapitalMarkets@kbw.com. Thesesecurities arenotinsuredor guaranteedby theFDICor any other governmentalagency or publicor privateinsurer.Neither theSECnor any other
regulatorybodyhasapprovedordisapproved ofthesecuritiesoftheCompanyorpassedontheadequacyoraccuracyofthispresentation.Anyrepresentationtothecontraryisacriminaloffense. UseofNon‐GAAPFinancialMeasures This presentation contains one or more
non‐GAAP financial measures determined by methods other than in accordance with generally accepted accounting principles. We use such non‐GAAP
financialmeasures,includingefficiencyratio,asadjusted,toprovidemeaningfulsupplementalinformationregardingourperformance.Webelievethesenon‐GAAPmeasuresandratiosarebeneficial
inassessingouroperatingresultsandrelatedtrends,andwhenplanningandforecastingfutureperiods.Thesenon‐GAAPdisclosuresshouldbeconsideredinadditionto,andnotasasubstituteforor preferable to, financial results determined in accordance with GAAP. The
non‐GAAP financial measures we use may differ from the non‐GAAP financial measures other financial institutions use to
measuretheirresultsofoperations.Areconciliationofanynon‐GAAPfinancialmeasuresusedinthispresentationtothemostdirectlycomparableGAAPfinancialmeasureisincludedintheappendix attheendofthispresentation.
AdditionalImportantInformationandWheretoFindIt In connection with the proposed acquisition of Lakeland, the Company has filed with the SEC a Registration Statement on Form S‐4 (the Registration Statement) to register the shares of the
Company’s common stock to be issued to shareholders of Lakeland in connection with the transaction. The Registration Statement includes a joint proxy statement of the Company and Lakeland and
aprospectusoftheCompany,aswellasotherrelevantmaterialsregardingtheproposedmergertransactioninvolvingtheCompanyandLakeland. ThirdPartySources Certain information contained in this presentation and oral statements made during this presentation relate
to or are based upon publications and data obtained from third party sources. While the Company believes these sources to be reliable as of the date of this presentation, the Company has not independently verified such information, and makes no
representation as to its accuracy, adequacy,fairnessorcompleteness. 3
TOPICS FORDISCUSSION Provident Financial Services Overview Financial
Overview Loan Portfolio & Asset Quality Funding & Liquidity Management Regulatory Capital Appendix 4
PROVIDENTFINANCIALSERVICESOVERVIEW
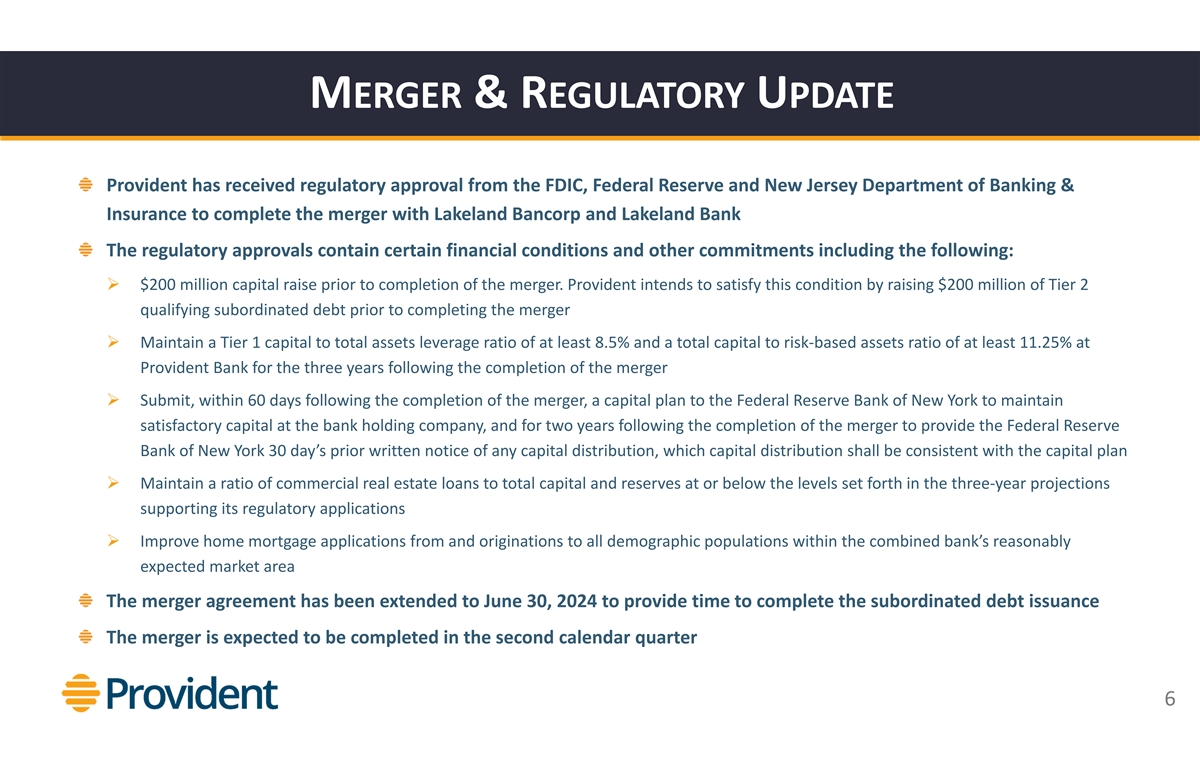
MERGER& REGULATORYUPDATE Provident has received regulatory approval
from the FDIC, Federal Reserve and New Jersey Department of Banking & Insurance to complete the merger with Lakeland Bancorp and Lakeland Bank The regulatory approvals contain certain financial conditions and other commitments including the
following: Ø $200 million capital raise prior to completion of the merger. Provident intends to satisfy this condition by raising $200 million of Tier 2 qualifying subordinated debt prior to completing the merger Ø Maintain a Tier 1
capital to total assets leverage ratio of at least 8.5% and a total capital to risk‐based assets ratio of at least 11.25% at Provident Bank for the three years following the completion of the merger Ø Submit, within 60 days following the
completion of the merger, a capital plan to the Federal Reserve Bank of New York to maintain satisfactory capital at the bank holding company, and for two years following the completion of the merger to provide the Federal Reserve Bank of New York
30 day’s prior written notice of any capital distribution, which capital distribution shall be consistent with the capital plan Ø Maintain a ratio of commercial real estate loans to total capital and reserves at or below the levels set
forth in the three‐year projections supporting its regulatory applications Ø Improve home mortgage applications from and originations to all demographic populations within the combined bank’s reasonably expected market area The
merger agreement has been extended to June 30, 2024 to provide time to complete the subordinated debt issuance The merger is expected to be completed in the second calendar quarter 6
THENEWPROVIDENTFINANCIALSERVICES, INC.
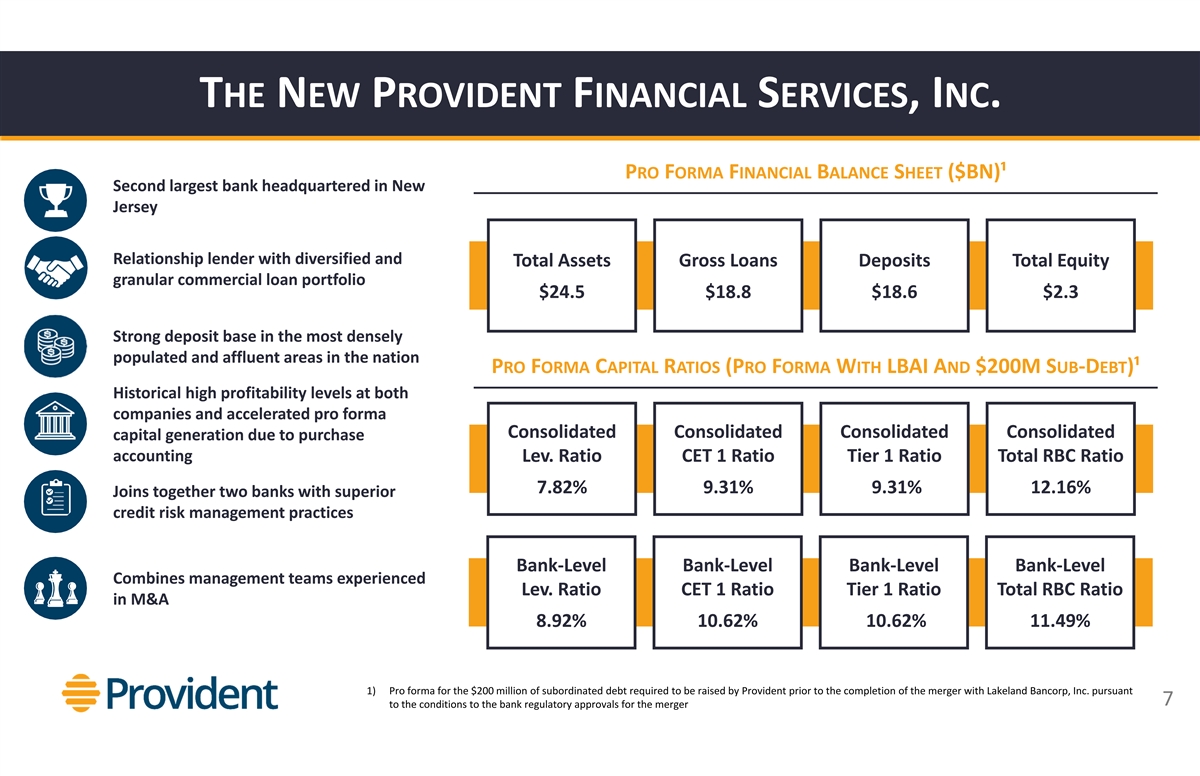
PROFORMAFINANCIALBALANCESHEET($BN)¹ Second largest bank headquartered in New Jersey Relationship lender with diversified and Total Assets Gross Loans Deposits Total Equity granular commercial loan portfolio $24.5 $18.8 $18.6 $2.3 Strong deposit
base in the most densely populated and affluent areas in the nation PROFORMACAPITALRATIOS(PROFORMAWITHLBAI AND$200M SUB‐DEBT)¹ Historical high profitability levels at both companies and accelerated pro forma Consolidated Consolidated
Consolidated Consolidated capital generation due to purchase accounting Lev. Ratio CET 1 Ratio Tier 1 Ratio Total RBC Ratio 7.82% 9.31% 9.31% 12.16% Joins together two banks with superior credit risk management practices Bank‐Level
Bank‐Level Bank‐Level Bank‐Level Combines management teams experienced Lev. Ratio CET 1 Ratio Tier 1 Ratio Total RBC Ratio in M&A 8.92% 10.62% 10.62% 11.49% 1) Pro forma for the $200 million of subordinated debt required to be
raised by Provident prior to the completion of the merger with Lakeland Bancorp, Inc. pursuant 7 to the conditions to the bank regulatory approvals for the merger

WELLPOSITIONED INHIGHLYATTRACTIVEMARKETS HIGHLY RANKED DEPOSIT MARKET
SHARE INNJ FOR Connecticut New York INSTITUTIONS WITH LESS THAN$100B INASSETS Overall Institution (HQ State) Rank Deposits ($000s)¹ Share (%)¹ Pennsylvania 1 Valley National Bancorp (NJ) $30,314,708 6.82% Pro Forma PFS & LBAI
$18,180,794 4.09% Provident Financial Services (NJ) $9,791,779 2.20% 2 3 OceanFirst Financial Corp. (NJ) $9,607,224 2.16% Lakeland Bancorp (NJ) $8,389,015 1.89% 4 5 Columbia Financial Inc. (NJ) $7,810,198 1.76% 6 ConnectOne Bancorp Inc. (NJ)
$6,867,977 1.55% New Jersey 7 CRB Group Inc. (NJ) $6,342,820 1.43% 8 Kearny Financial Corp. (NJ) $5,565,751 1.25% 9 Peapack-Gladstone Financial (NJ) $5,216,536 1.17% 10 Fulton Financial Corp. (PA) $4,517,277 1.02% PFS (96) Total for Institutions in
New Jersey $444,442,359 LBAI (69) 1) Deposit data as of June 30th, 2023; Deposit Share analysis includes institutions with $100B or less in total assets; Sourced from FDIC data 8
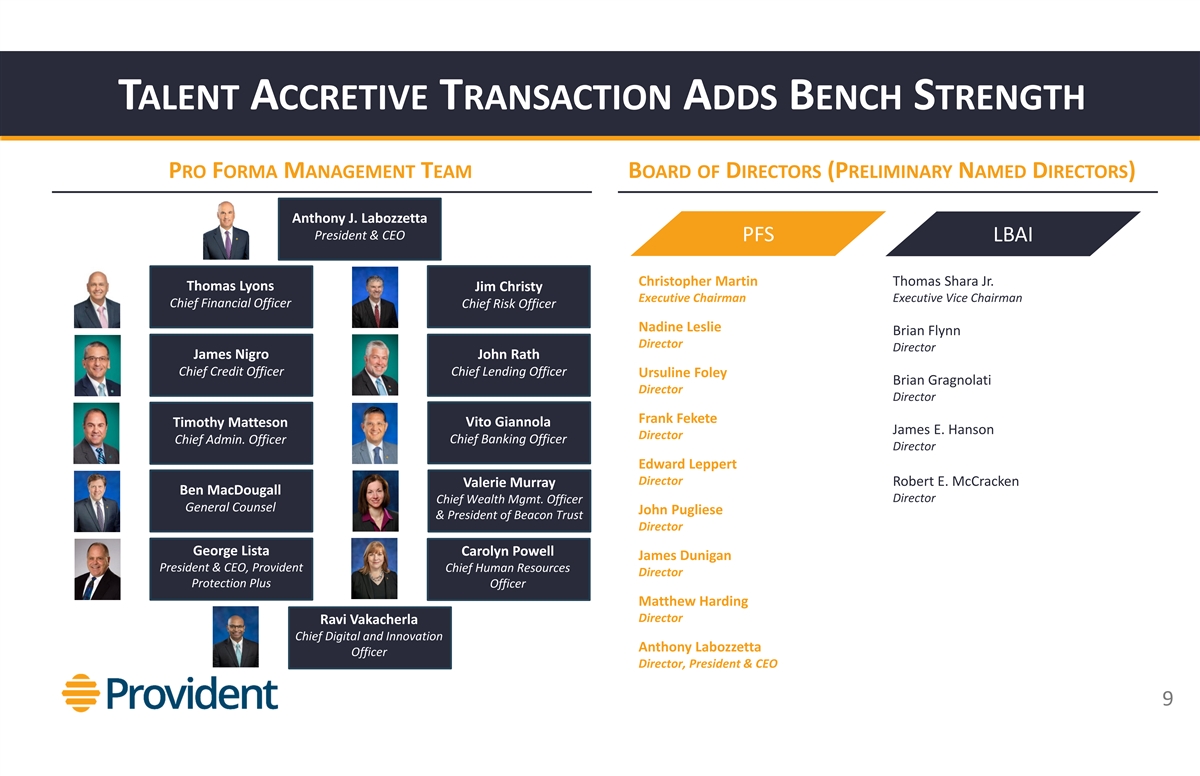
TALENTACCRETIVETRANSACTIONADDSBENCHSTRENGTH PROFORMAMANAGEMENTTEAM BOARD
OFDIRECTORS(PRELIMINARYNAMEDDIRECTORS) Anthony J. Labozzetta President & CEO PFS LBAI Christopher Martin Thomas SharaJr. Thomas Lyons Jim Christy Executive Chairman Executive Vice Chairman Chief Financial Officer Chief Risk Officer Nadine Leslie
Brian Flynn Director Director James Nigro John Rath Chief Credit Officer Chief Lending Officer Ursuline Foley Brian Gragnolati Director Director Frank Fekete Vito Giannola Timothy Matteson James E. Hanson Director Chief Banking Officer Chief Admin.
Officer Director Edward Leppert Director Robert E. McCracken Valerie Murray Ben MacDougall Director Chief Wealth Mgmt. Officer General Counsel John Pugliese & President of Beacon Trust Director George Lista Carolyn Powell James Dunigan President
& CEO, Provident Chief Human Resources Director Protection Plus Officer Matthew Harding Director Ravi Vakacherla Chief Digital and Innovation Anthony Labozzetta Officer Director, President & CEO 9

GROWTHACHIEVEDTHROUGH ANORGANICSTRATEGY AUGMENTED BYDISCIPLINEDM&A
EXPERIENCEDBANKPARTNERSADDINGSCALE… …SUPPLEMENTED BYFEEINCOMEDEALS Consistent organic growth has been supplemented by select, Lakeland Bancorp acquisition will provide asset‐based lending and opportunistic whole bank acquisitions
that have been conservatively mortgage warehouse lending priced and modeled Wealth management has been a key priority in last decade, resulting in PROVIDENTACQUISITIONS strong diversification of revenue May 2014: July 2020: September 2022:
Acquisition of SB One Bancorp enhanced fee‐based business and fee Team Capital Bank SB One Bancorp Lakeland Bancorp generation provided by Provident Protection Plus insurance agency ‐ $115MM value¹ ‐ $186MM value¹ ‐
$1.3BN value¹ ‐ $949MM assets¹ ‐ $2.1BN assets¹ ‐ $10.4BN assets¹ TOTALASSETS($BN) WEALTHMANAGEMENTACQUISITIONS Deal Year Description Tirschwell& Loewy 2019 NYC‐based RIA with $823M¹ in AUM
In‐market acquisition of Morristown‐ MDE Group 2015 based RIA Suffolk Bancorp’s All wealth management assets of Suffolk 2014 January 2016: July 2016: January 2019: January 2022: WM business County National Bank PascackBancorp, Inc.
Harmony Bank Highlands Bancorp, Inc. 1st Constitution Bancorp ‐ $43MM value¹ ‐ $36MM value¹ ‐ $43MM value¹ ‐ $277MM value¹ Morristown‐based trust and wealth ‐ $391MM assets¹ ‐ $314MM
assets¹ ‐ $485MM assets¹ ‐ $1.9BN assets¹ Beacon Trust 2011 management company LAKELANDACQUISITIONS 1) Reflects deal value as of closing; Total assets and assets under management as of the quarter prior to the completion
date ofeach transaction (LBAI deal value and total assets as of announcement and the quarter prior to announcement respectively); Sourced from S&P Capital IQ Pro 10 2) Pro forma for the merger with Lakeland Bancorp, Inc.

HISTORICALLYSTRONGCREDITCULTURE PFS and LBAI have a historically strong
credit culture with average NCOs / Average Loans of 21 and 39 bps since 2008, respectively The combined platform will continue using the strong underwriting and review methods of the legacy companies Each party reviewed ~50% of the
counterparty’s commercial loan portfolio throughout merger process NCOS/ AVERAGELOANS 1) Sourced from Federal Reserve Economic Data; Includes all Commercial Banks; Q1 2024 National Average is not yet available 11 2) Reflects annualized metrics
for Q1 2024 financials
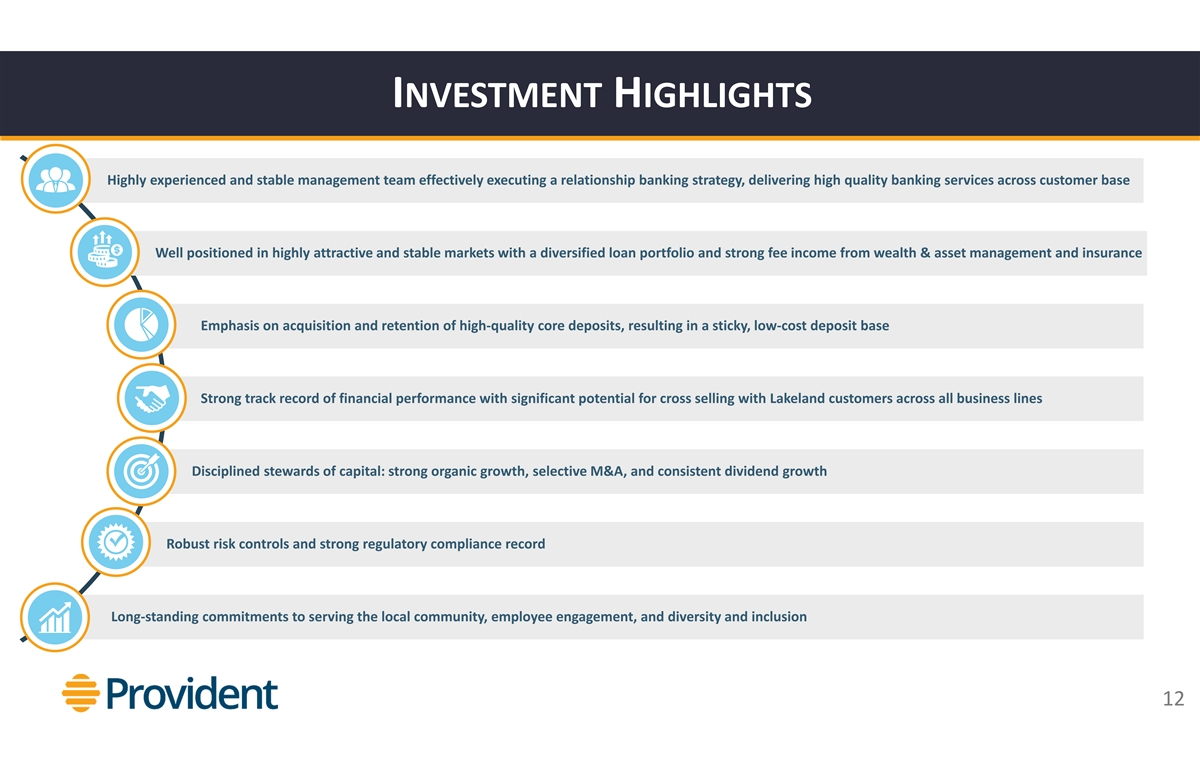
INVESTMENTHIGHLIGHTS Highly experienced and stable management team
effectively executing a relationship banking strategy, delivering high quality banking services across customer base Well positioned in highly attractive and stable markets with a diversified loan portfolio and strong fee income from wealth
&asset management and insurance Emphasis on acquisition and retention of high‐quality core deposits, resulting in a sticky, low‐cost deposit base Strong track record of financial performance with significant potential for cross
selling with Lakeland customers across all business lines Disciplined stewards of capital: strong organic growth, selective M&A, and consistent dividend growth Robust risk controls and strong regulatory compliance record Long‐standing
commitments to serving the local community, employee engagement, and diversity and inclusion 12
FINANCIALOVERVIEW

HISTORY OFTARGETEDBALANCESHEETGROWTH TOTALASSETS($BN)
TOTALGROSSLOANS($BN) TOTALDEPOSITS($BN) TANGIBLECOMMONEQUITY($BN)² 1) Pro forma for the merger with Lakeland Bancorp, Inc. 14 2) Represents a non‐GAAP measure. See Appendix for corresponding Reconciliations to GAAP Measures
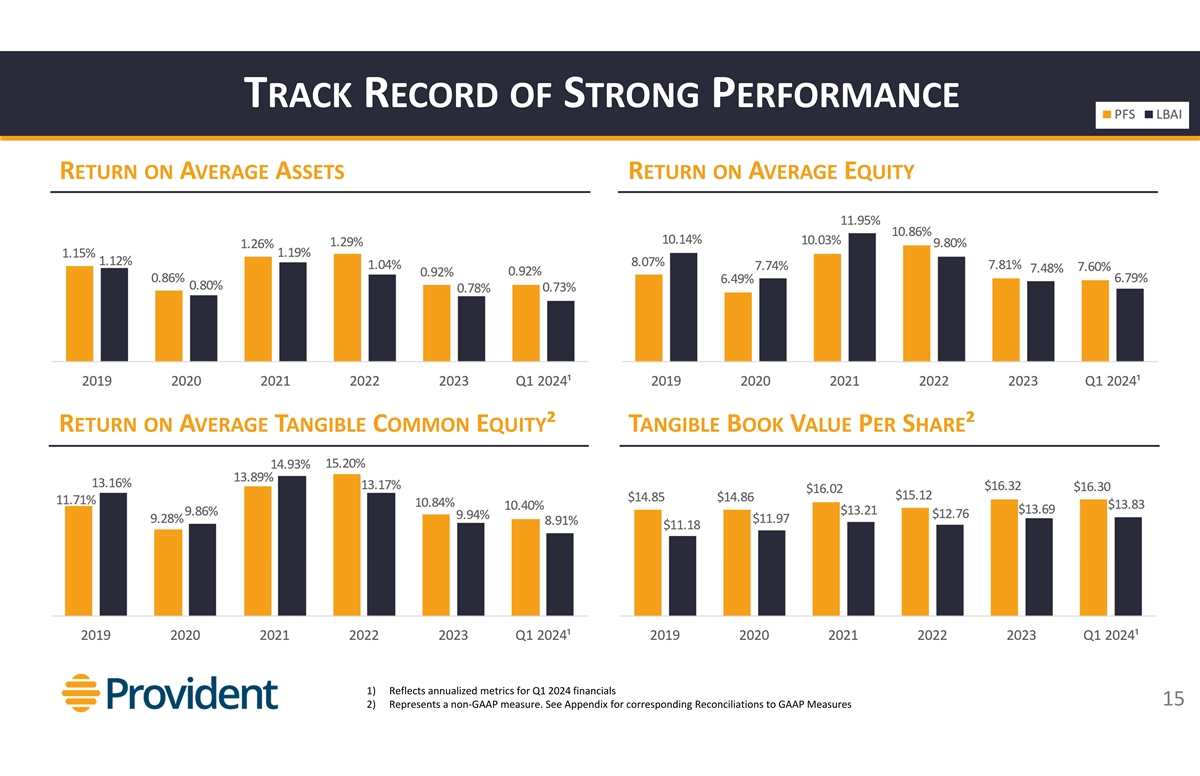
TRACKRECORD OFSTRONGPERFORMANCE RETURN ONAVERAGEASSETS RETURN
ONAVERAGEEQUITY RETURN ONAVERAGETANGIBLECOMMONEQUITY² TANGIBLEBOOKVALUEPERSHARE² 1) Reflects annualized metrics for Q1 2024 financials 15 2) Represents a non‐GAAP measure. See Appendix for corresponding Reconciliations to GAAP
Measures
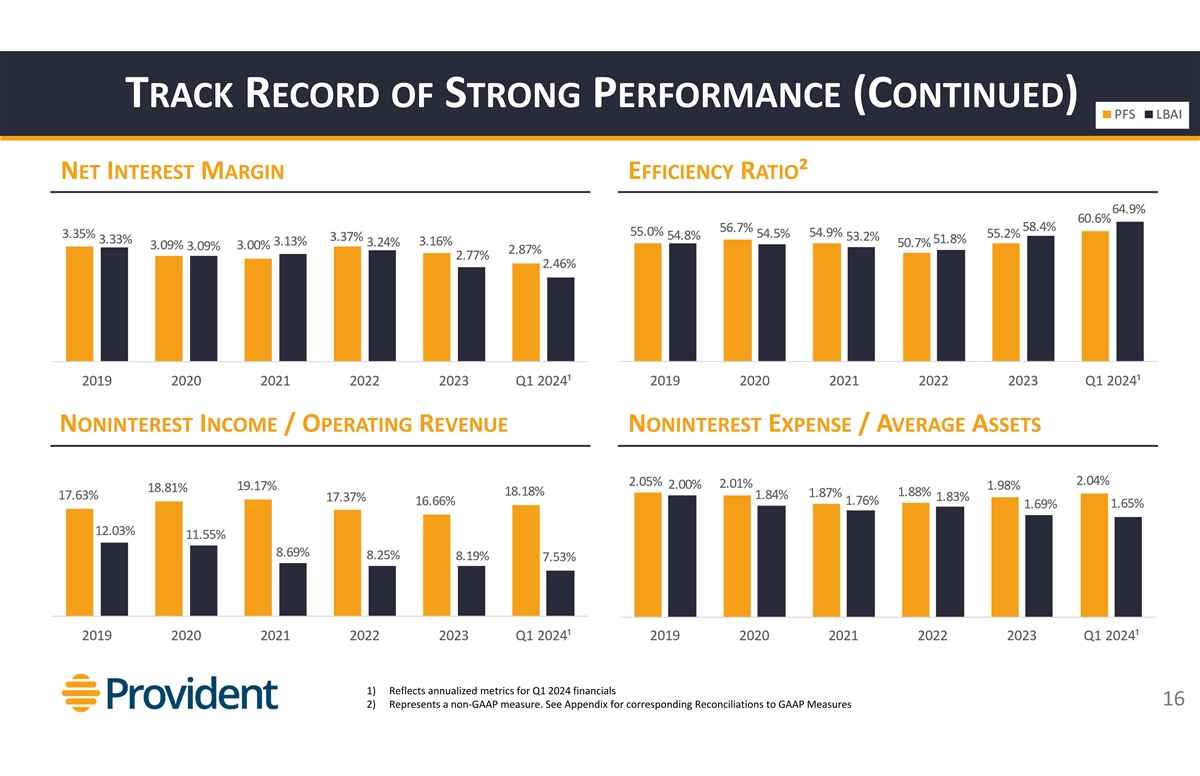
TRACKRECORD OFSTRONGPERFORMANCE(CONTINUED) NETINTERESTMARGIN
EFFICIENCYRATIO² NONINTERESTINCOME/ OPERATINGREVENUE NONINTERESTEXPENSE/ AVERAGEASSETS 1) Reflects annualized metrics for Q1 2024 financials 16 2) Represents a non‐GAAP measure. See Appendix for corresponding Reconciliations to GAAP
Measures
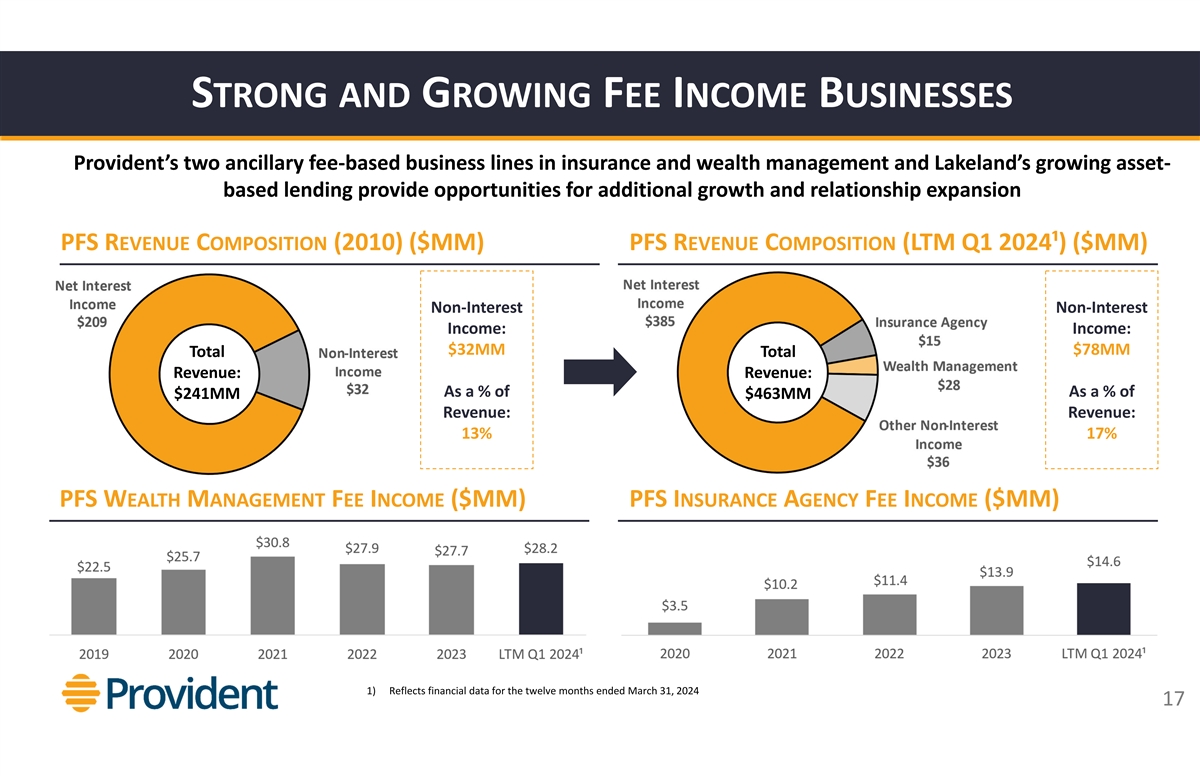
STRONG ANDGROWINGFEEINCOMEBUSINESSES Provident’stwo ancillary
fee‐based business lines in insurance and wealth management and Lakeland’s growing asset‐ based lending provide opportunities for additional growth and relationship expansion PFS REVENUECOMPOSITION(2010) ($MM) PFS
REVENUECOMPOSITION(LTM Q1 2024¹) ($MM) Non‐Interest Non‐Interest Income: Income: $32MM $78MM Total Total Revenue: Revenue: As a % of As a % of $241MM $463MM Revenue: Revenue: 13% 17% PFS WEALTHMANAGEMENTFEEINCOME($MM) PFS
INSURANCEAGENCYFEEINCOME($MM) 1) Reflects financial data for the twelve months ended March 31, 2024 17
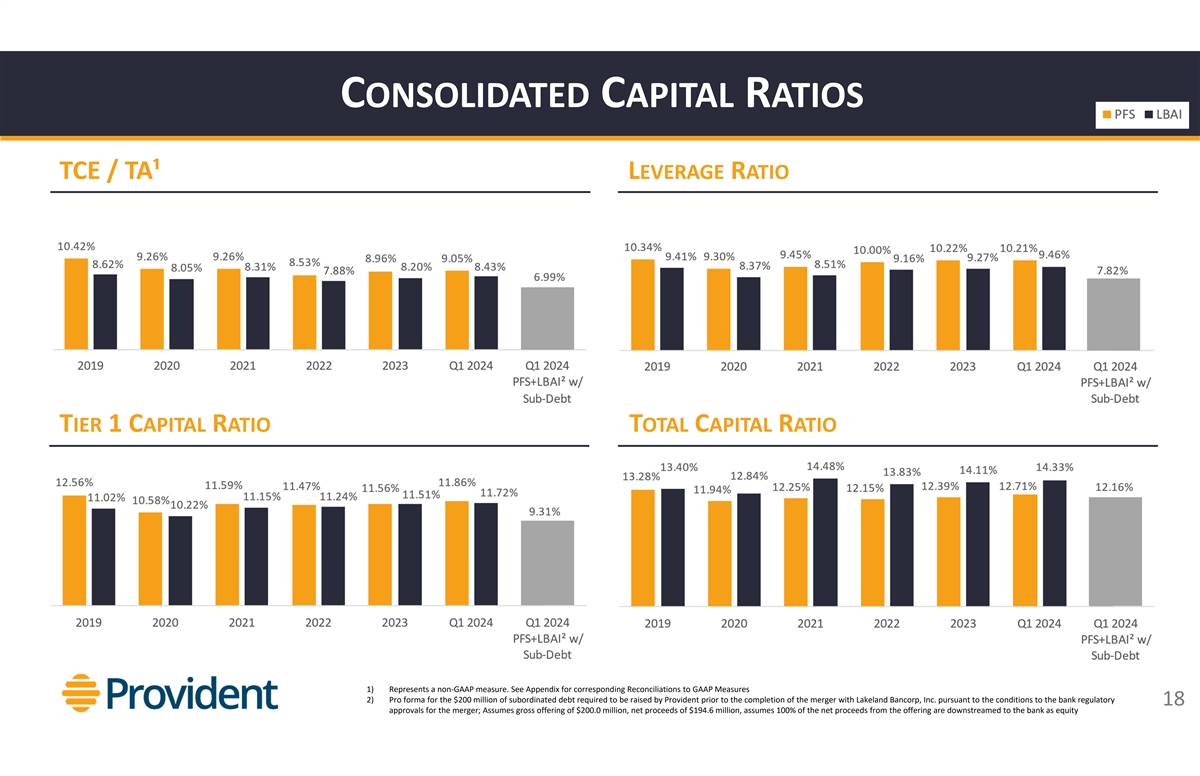
CONSOLIDATEDCAPITALRATIOS TCE / TA¹ LEVERAGERATIO TIER1
CAPITALRATIO TOTALCAPITALRATIO 1) Represents a non‐GAAP measure. See Appendix for corresponding Reconciliations to GAAP Measures 2) Pro forma for the $200 million of subordinated debt required to be raised by Provident prior to the completion
of the merger with Lakeland Bancorp, Inc. pursuant to the conditions to the bank regulatory 18 approvals for the merger; Assumes gross offering of $200.0 million, net proceeds of $194.6 million, assumes 100% of the net proceeds from the offering are
downstreamedto the bank as equity
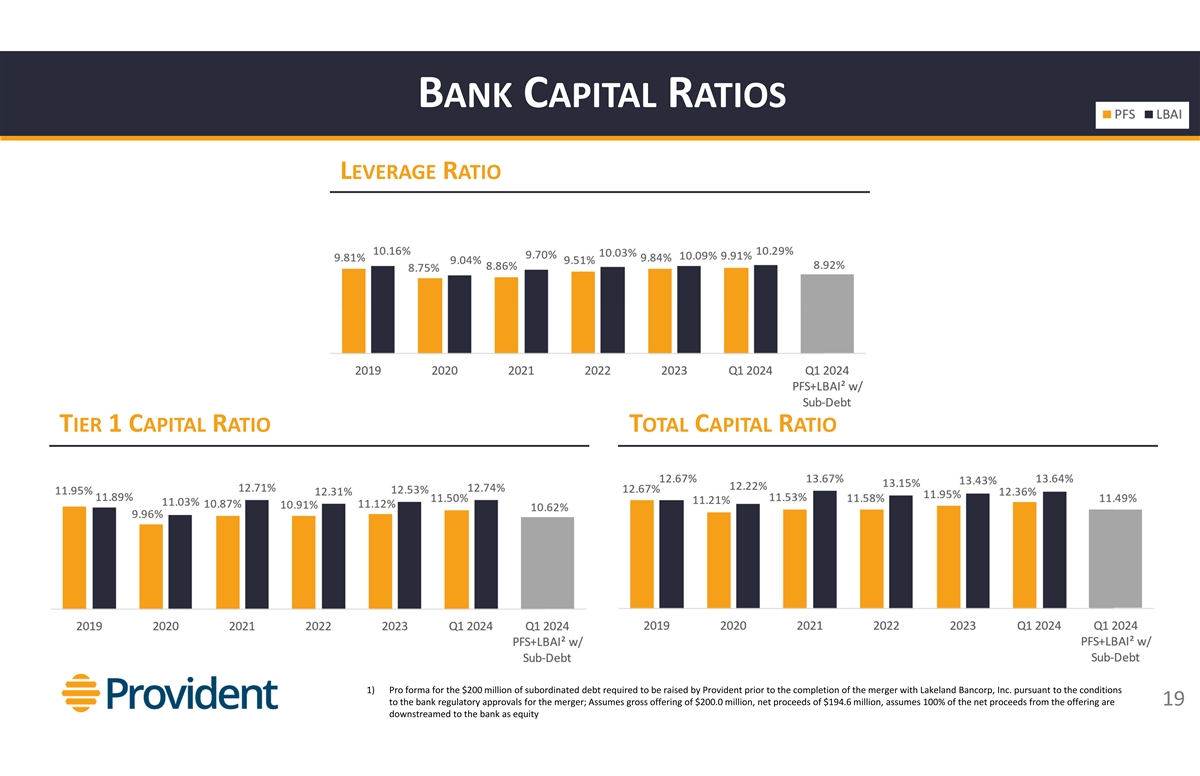
BANKCAPITALRATIOS LEVERAGERATIO TIER1 CAPITALRATIO TOTALCAPITALRATIO 1)
Pro forma for the $200 million of subordinated debt required to be raised by Provident prior to the completion of the merger with Lakeland Bancorp, Inc. pursuant to the conditions to the bank regulatory approvals for the merger; Assumes gross
offering of $200.0 million, net proceeds of $194.6 million, assumes 100% of the net proceeds from the offering are 19 downstreamedto the bank as equity
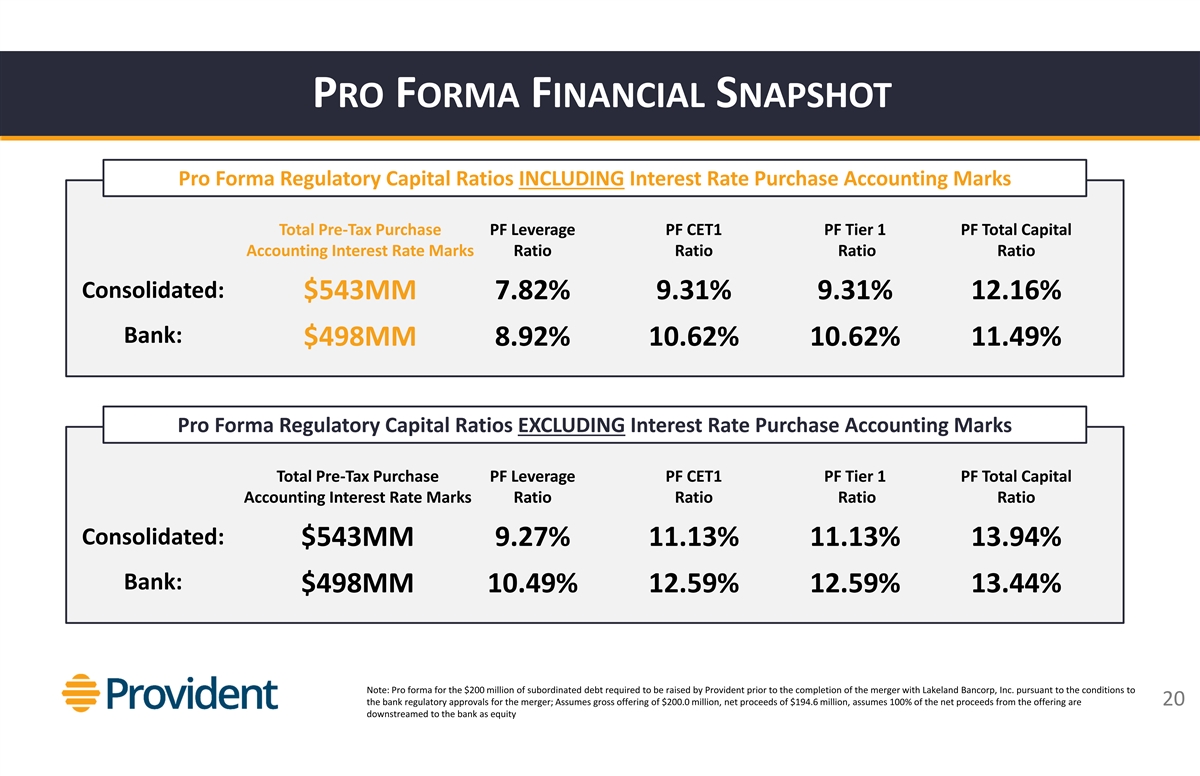
PROFORMAFINANCIALSNAPSHOT Pro Forma Regulatory Capital Ratios
INCLUDINGInterest Rate Purchase Accounting Marks Total Pre‐Tax Purchase PF Leverage PF CET1 PF Tier 1 PF Total Capital Accounting Interest Rate Marks Ratio Ratio Ratio Ratio Consolidated: $543MM 7.82% 9.31% 9.31% 12.16% Bank: $498MM 8.92%
10.62% 10.62% 11.49% Pro Forma Regulatory Capital Ratios EXCLUDINGInterest Rate Purchase Accounting Marks Total Pre‐Tax Purchase PF Leverage PF CET1 PF Tier 1 PF Total Capital Accounting Interest Rate Marks Ratio Ratio Ratio Ratio
Consolidated: $543MM 9.27% 11.13% 11.13% 13.94% Bank: $498MM 10.49% 12.59% 12.59% 13.44% Note: Pro forma for the $200 million of subordinated debt required to be raised by Provident prior to the completion of the merger with Lakeland Bancorp, Inc.
pursuant to the conditions to the bank regulatory approvals for the merger; Assumes gross offering of $200.0 million, net proceeds of $194.6 million, assumes 100% of the net proceeds from the offering are 20 downstreamedto the bank as
equity

LOANPORTFOLIO& ASSETQUALITY
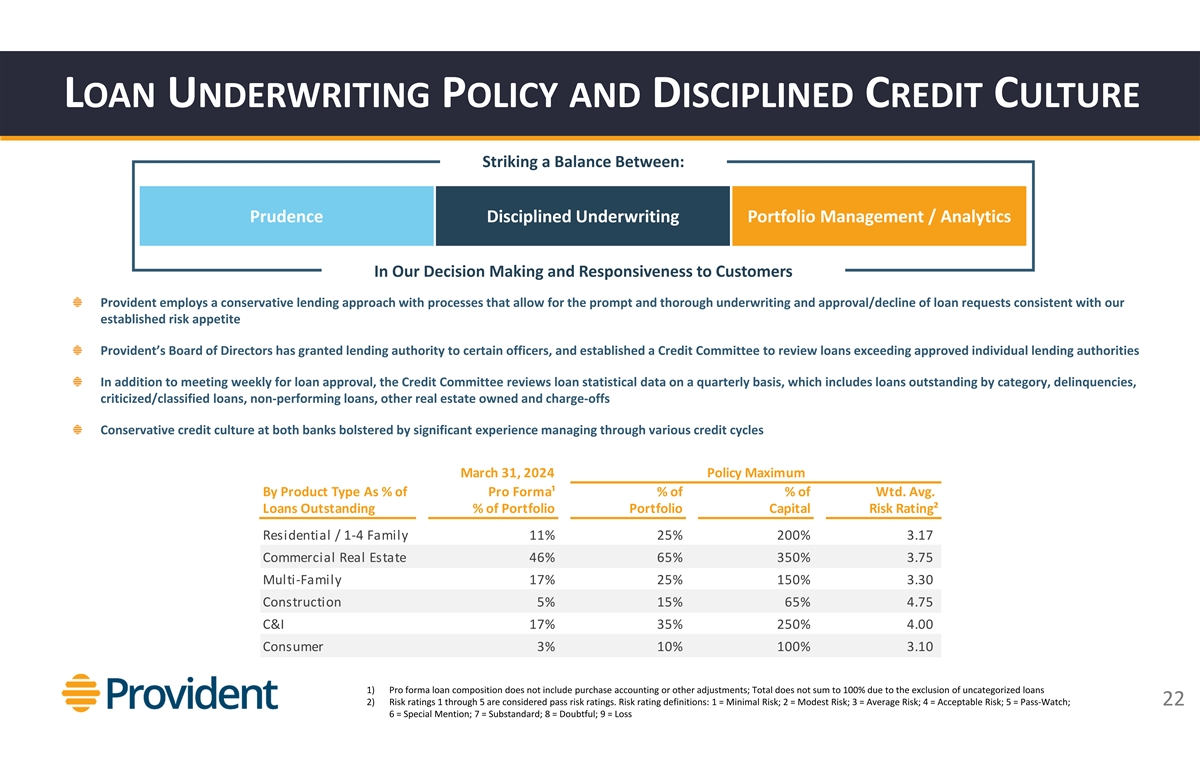
LOANUNDERWRITINGPOLICY ANDDISCIPLINEDCREDITCULTURE Striking a Balance
Between: Prudence Disciplined Underwriting Portfolio Management / Analytics In Our Decision Making and Responsiveness to Customers Provident employs a conservative lending approach with processes that allow for the prompt and thorough underwriting
and approval/decline of loan requests consistent with our established risk appetite Provident’sBoard of Directors has granted lending authority to certain officers, and established a Credit Committee to review loans exceeding approved
individual lending authorities In addition to meeting weekly for loan approval, the Credit Committee reviews loan statistical data on a quarterly basis, which includes loans outstanding by category, delinquencies, criticized/classified loans,
non‐performing loans, other real estate owned and charge‐offs Conservative credit culture at both banks bolstered by significant experience managing through various credit cycles March 31, 2024 Policy Maximum By Product Type As % of Pro
Forma¹ % of % of Wtd. Avg. Loans Outstanding % of Portfolio Portfolio Capital Risk Rating² Residential / 1‐4 Family 11% 25% 200% 3.17 Commercial Real Estate 46% 65% 350% 3.75 Multi‐Family 17% 25% 150% 3.30 Construction 5% 15%
65% 4.75 C&I 17% 35% 250% 4.00 Consumer 3% 10% 100% 3.10 1) Pro forma loan composition does not include purchase accounting or other adjustments; Total does not sum to 100% due to the exclusion of uncategorized loans 2) Risk ratings 1 through 5
are considered pass risk ratings. Risk rating definitions: 1 = Minimal Risk; 2 = Modest Risk; 3 = Average Risk; 4 = Acceptable Risk; 5 = Pass‐Watch; 22 6 = Special Mention; 7 = Substandard; 8 = Doubtful; 9 = Loss
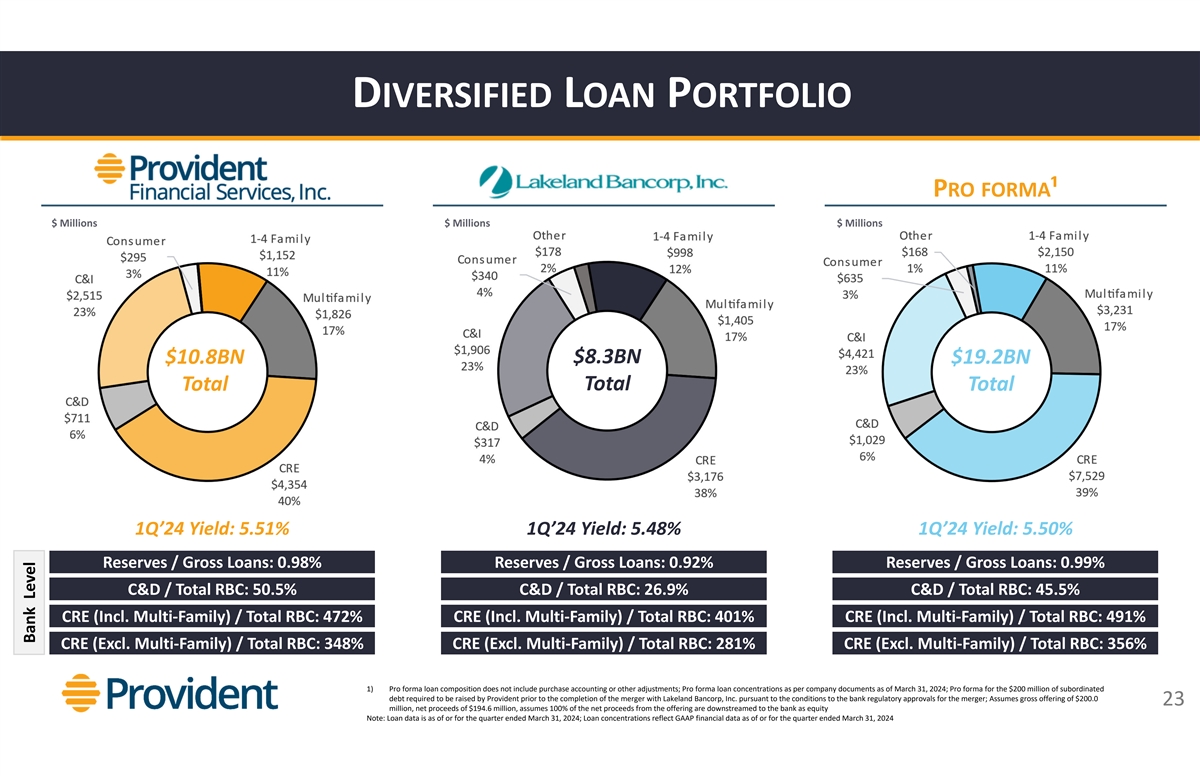
DIVERSIFIEDLOANPORTFOLIO PRO FORMA¹ $ Millions $ Millions $
Millions $10.8BN $8.3BN $19.2BN Total Total Total 1Q’24 Yield: 5.51% 1Q’24 Yield: 5.48% 1Q’24 Yield: 5.50% Reserves / Gross Loans: 0.98% Reserves / Gross Loans: 0.92% Reserves / Gross Loans: 0.99% C&D / Total RBC: 50.5% C&D
/ Total RBC: 26.9% C&D / Total RBC: 45.5% CRE (Incl. Multi‐Family) / Total RBC: 472% CRE (Incl. Multi‐Family) / Total RBC: 401% CRE (Incl. Multi‐Family) / Total RBC: 491% CRE (Excl. Multi‐Family) / Total RBC: 348% CRE
(Excl. Multi‐Family) / Total RBC: 281% CRE (Excl. Multi‐Family) / Total RBC: 356% 1) Pro forma loan composition does not include purchase accounting or other adjustments; Pro forma loan concentrations as per company documents as of March
31, 2024; Pro forma for the $200 million of subordinated debt required to be raised by Provident prior to the completion of the merger with Lakeland Bancorp, Inc. pursuant to the conditions to the bank regulatory approvals for the merger; Assumes
gross offering of $200.0 23 million, net proceeds of $194.6 million, assumes 100% of the net proceeds from the offering are downstreamedto the bank as equity Note: Loan data is as of or for the quarter ended March 31, 2024; Loan concentrations
reflect GAAP financial data as of or for the quarter ended March 31, 2024 Bank Level

LOANPORTFOLIOCONCENTRATIONS LBAI CRE / TOTALRBC PFS CRE / TOTALRBC PFS
C&D / TOTALRBC LBAI C&D / TOTALRBC 1) Pro forma for the $200 million of subordinated debt required to be raised by Provident prior to the completion of the merger with Lakeland Bancorp, Inc. pursuant 24 to the conditions to the bank
regulatory approvals for the merger
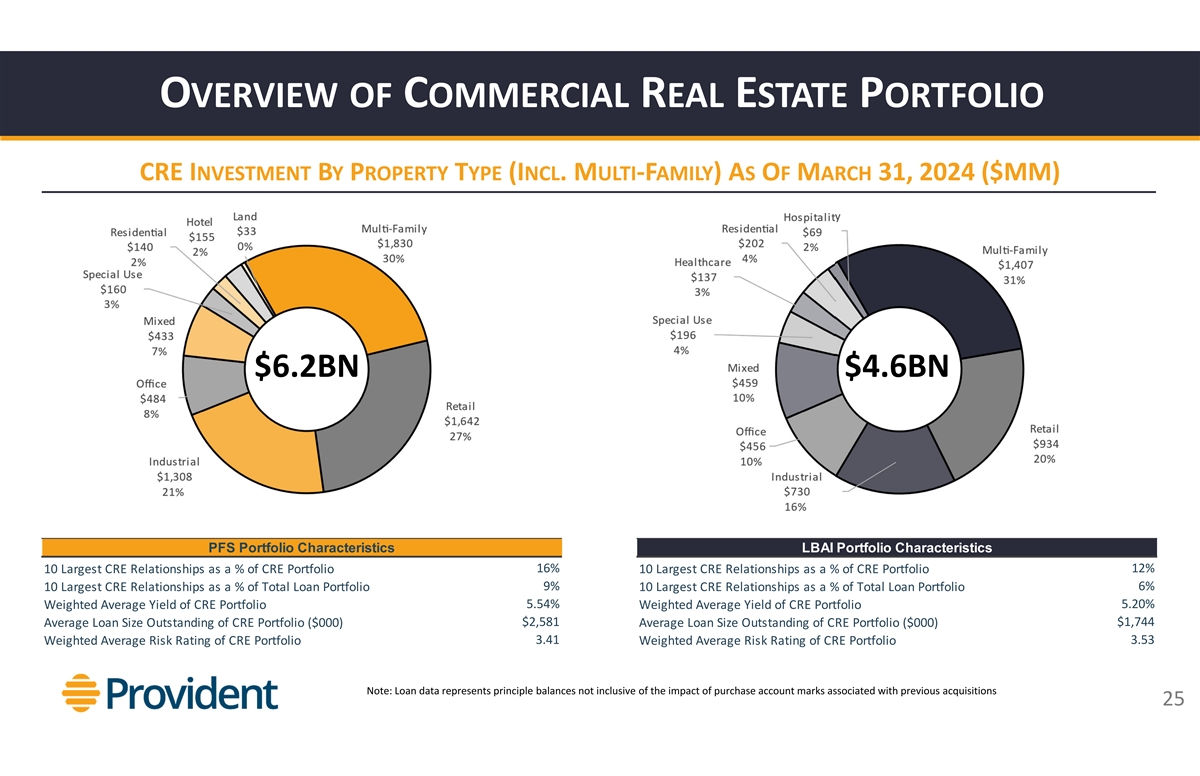
OVERVIEW OFCOMMERCIALREALESTATEPORTFOLIO CRE
INVESTMENTBYPROPERTYTYPE(INCL. MULTI‐FAMILY) ASOFMARCH31, 2024 ($MM) $6.2BN $4.6BN PFS Portfolio Characteristics LBAI Portfolio Characteristics 16% 12% 10 Largest CRE Relationships as a % of CRE Portfolio 10 Largest CRE Relationships as a % of
CRE Portfolio 9% 6% 10 Largest CRE Relationships as a % of Total Loan Portfolio 10 Largest CRE Relationships as a % of Total Loan Portfolio 5.54% 5.20% Weighted Average Yield of CRE Portfolio Weighted Average Yield of CRE Portfolio $2,581 $1,744
Average Loan Size Outstanding of CRE Portfolio ($000) Average Loan Size Outstanding of CRE Portfolio ($000) 3.41 3.53 Weighted Average Risk Rating of CRE Portfolio Weighted Average Risk Rating of CRE Portfolio Note: Loan data represents principle
balances not inclusive of the impact of purchase account marks associated with previous acquisitions 25
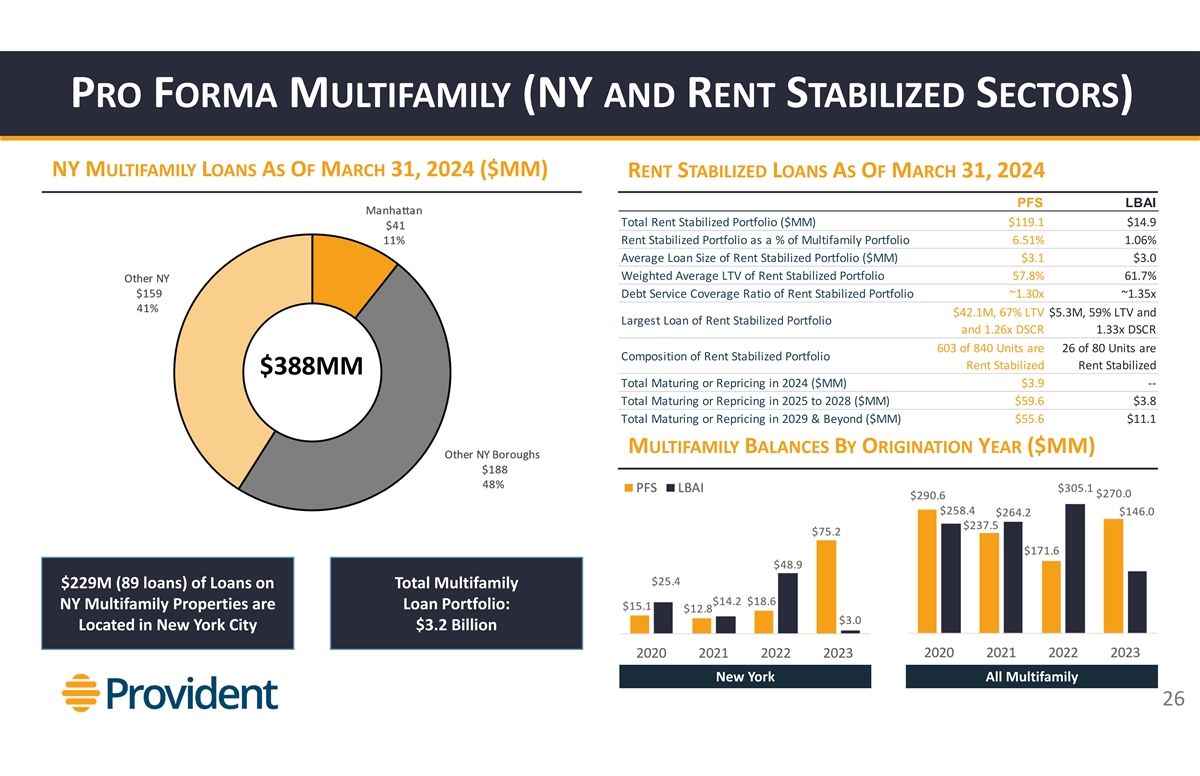
PROFORMAMULTIFAMILY(NY ANDRENTSTABILIZEDSECTORS) NY
MULTIFAMILYLOANSASOFMARCH31, 2024 ($MM) RENTSTABILIZEDLOANSASOFMARCH31, 2024 PFS LBAI Total Rent Stabilized Portfolio ($MM) $119.1 $14.9 Rent Stabilized Portfolio as a % of Multifamily Portfolio 6.51% 1.06% Average Loan Size of Rent Stabilized
Portfolio ($MM) $3.1 $3.0 Weighted Average LTV of Rent Stabilized Portfolio 57.8% 61.7% Debt Service Coverage Ratio of Rent Stabilized Portfolio ~1.30x ~1.35x $42.1M, 67% LTV $5.3M, 59% LTV and Largest Loan of Rent Stabilized Portfolio and 1.26x
DSCR 1.33x DSCR 603 of 840 Units are 26 of 80 Units are Composition of Rent Stabilized Portfolio Rent Stabilized Rent Stabilized $388MM Total Maturing or Repricing in 2024 ($MM) $3.9 ‐‐ Total Maturing or Repricing in 2025 to 2028 ($MM)
$59.6 $3.8 Total Maturing or Repricing in 2029 & Beyond ($MM) $55.6 $11.1 MULTIFAMILYBALANCESBYORIGINATIONYEAR($MM) [ ] $229M (89 loans) of Loans on Total Multifamily [ ] NY Multifamily Properties are Loan Portfolio: [ ] Located in New York City
$3.2 Billion New York All Multifamily 26

CRE OFFICEPORTFOLIOOVERVIEW PFS CRE OFFICEPORTFOLIOASOFMARCH31, 2024
($MM) LBAI CRE OFFICEPORTFOLIOASOFMARCH31, 2024 ($MM) $484MM $456MM $47MM maturing or repricing in 2024 $118MM maturing or repricing in 2024 $265MM maturing in repricing in 2025 to 2028 $274MM maturing in repricing in 2025 to 2028 $171MM maturing or
repricing in 2029 & beyond $64MM maturing or repricing in 2029 & beyond LTVs > 70%:~$23MM, or ~5% of total office portfolio LTVs > 70%:~$11MM, or ~3% of total office portfolio 27

OVERVIEW OFC&I PORTFOLIO C&I PORTFOLIOBYINDUSTRYASOFMARCH31,
2024 ($MM) $2.5BN $1.9BN PFS Portfolio Characteristics LBAI Portfolio Characteristics 10 Largest C&I Relationships as a % of C&I Portfolio 14% 10 Largest C&I Relationships as a % of C&I Portfolio 16% 3% 4% 10 Largest C&I
Relationships as a % of Total Loan Portfolio 10 Largest C&I Relationships as a % of Total Loan Portfolio 6.03% 5.93% Weighted Average Yield of C&I Portfolio Weighted Average Yield of C&I Portfolio $774 $857 Average Loan Size Outstanding
of C&I Portfolio ($000) Average Loan Size Outstanding of C&I Portfolio ($000) Weighted Average Risk Rating of C&I Portfolio 3.82 Weighted Average Risk Rating of C&I Portfolio 3.53 Note: Loan data represents principle balances not
inclusive of the impact of purchase account marks associated with previous acquisitions 28
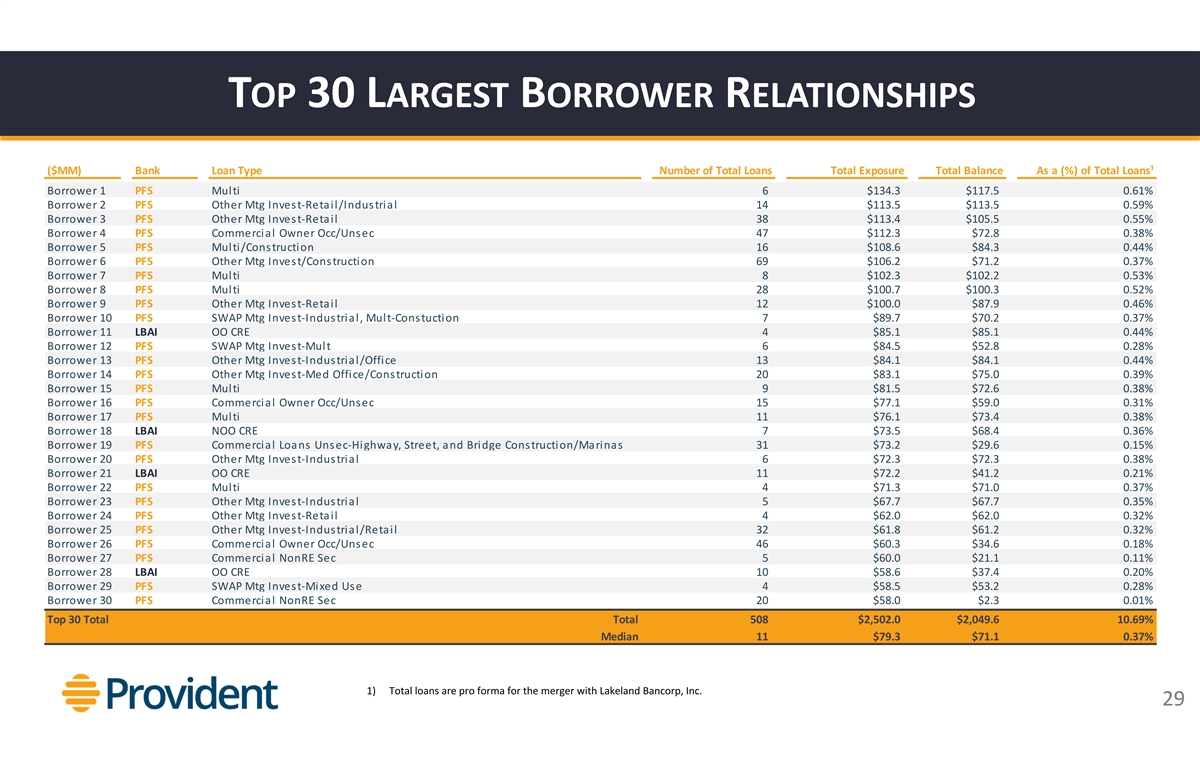
TOP30 LARGESTBORROWERRELATIONSHIPS ($MM) Bank Loan Type Number of Total
Loans Total Exposure Total Balance As a (%) of Total Loans¹ Borrower 1 PFS Multi 6 $134.3 $117.5 0.61% Borrower 2 PFS Other Mtg Invest‐Retail/Industrial 14 $113.5 $113.5 0.59% Borrower 3 PFS Other Mtg Invest‐Retail 38 $113.4 $105.5
0.55% Borrower 4 PFS Commercial Owner Occ/Unsec 47 $112.3 $72.8 0.38% Borrower 5 PFS Multi/Construction 16 $108.6 $84.3 0.44% Borrower 6 PFS Other Mtg Invest/Construction 69 $106.2 $71.2 0.37% Borrower 7 PFS Multi 8 $102.3 $102.2 0.53% Borrower 8
PFS Multi 28 $100.7 $100.3 0.52% Borrower 9 PFS Other Mtg Invest‐Retail 12 $100.0 $87.9 0.46% Borrower 10 PFS SWAP Mtg Invest‐Industrial, Mult‐Constuction 7 $89.7 $70.2 0.37% Borrower 11 LBAI OO CRE 4 $85.1 $85.1 0.44% Borrower 12
PFS SWAP Mtg Invest‐Mult 6 $84.5 $52.8 0.28% Borrower 13 PFS Other Mtg Invest‐Industrial/Office 13 $84.1 $84.1 0.44% Borrower 14 PFS Other Mtg Invest‐Med Office/Construction 20 $83.1 $75.0 0.39% Borrower 15 PFS Multi 9 $81.5 $72.6
0.38% Borrower 16 PFS Commercial Owner Occ/Unsec 15 $77.1 $59.0 0.31% Borrower 17 PFS Multi 11 $76.1 $73.4 0.38% Borrower 18 LBAI NOO CRE 7 $73.5 $68.4 0.36% Borrower 19 PFS Commercial Loans Unsec‐Highway, Street, and Bridge
Construction/Marinas 31 $73.2 $29.6 0.15% Borrower 20 PFS Other Mtg Invest‐Industrial 6 $72.3 $72.3 0.38% Borrower 21 LBAI OO CRE 11 $72.2 $41.2 0.21% Borrower 22 PFS Multi 4 $71.3 $71.0 0.37% Borrower 23 PFS Other Mtg Invest‐Industrial
5 $67.7 $67.7 0.35% Borrower 24 PFS Other Mtg Invest‐Retail 4 $62.0 $62.0 0.32% Borrower 25 PFS Other Mtg Invest‐Industrial/Retail 32 $61.8 $61.2 0.32% Borrower 26 PFS Commercial Owner Occ/Unsec 46 $60.3 $34.6 0.18% Borrower 27 PFS
Commercial NonRE Sec 5 $60.0 $21.1 0.11% Borrower 28 LBAI OO CRE 10 $58.6 $37.4 0.20% Borrower 29 PFS SWAP Mtg Invest‐Mixed Use 4 $58.5 $53.2 0.28% Borrower 30 PFS Commercial NonRE Sec 20 $58.0 $2.3 0.01% Top 30 Total Total 508 $2,502.0
$2,049.6 10.69% Median 11 $79.3 $71.1 0.37% 1) Total loans are pro forma for the merger with Lakeland Bancorp, Inc. 29

PFS: HISTORICALLYSTRONGASSETQUALITY& CREDITFUNDAMENTALS Our
Conservative Credit Culture Shows Through in Reserve Coverage and Limited Historical Charge‐Offs NPA TRENDS($MM) NCOS/ AVERAGELOANS(%) RESERVE/ LOANS(%) & RESERVES/ NPLS(%) 1) Reflects annualized metrics for Q1 2024 financials 30 2)
Sourced from Federal Reserve Economic Data; Includes all Commercial Banks; Q1 2024 National Average is not yet available

LBAI: HISTORICALLYSTRONGASSETQUALITY& CREDITFUNDAMENTALS Our
Conservative Credit Culture Shows Through in Reserve Coverage and Limited Historical Charge‐Offs NPA TRENDS($MM) NCOS/ AVERAGELOANS(%) RESERVE/ LOANS(%) & RESERVES/ NPLS(%) 1) Reflects annualized metrics for Q1 2024 financials 31 2)
Sourced from Federal Reserve Economic Data; Includes all Commercial Banks; Q1 2024 National Average is not yet available

FUNDING& LIQUIDITYMANAGEMENT

ATTRACTIVEDEPOSITBASEFUNDSDIVERSIFIEDLOANPORTFOLIO 4 PRO FORMA $
Millions $ Millions $ Millions $10.1BN $8.5BN $18.6BN Total Total Total 1 1Q’24 Cost of Total Deposits¹: 2.07% 1Q’24 Cost of Total Deposits¹ : 2.56% 1Q’24 Cost of Total Deposits : 2.29% Non‐Interest Bearing
Deposits: 19.8% Non‐Interest Bearing Deposits: 20.3% Non‐Interest Bearing Deposits: 20.0% Q1 2024 Core² Deposits: 83.5% Q1 2024 Core² Deposits: 94.5% 3 3 Funding profile remains strong with Uninsured Deposits / Deposits : 24.7%
Uninsured Deposits / Deposits : 27.1% ability to leverage incremental scale to minimize funding costs 1) Cost of total deposits reflects an annualized metric 2) Core deposits are total deposits less jumbo time deposits greater than $100,000 3)
Reflects uninsured and uncollateralized deposits as a percent of total deposits 33 4) Pro forma deposit composition does not include purchase accounting adjustments Note: Deposit data is as of or for the quarter ended March 31, 2024

ATTRACTIVEDEPOSITBASEFUNDSDIVERSIFIEDLOANPORTFOLIO PFS CORE¹
DEPOSITTRENDS LBAI CORE¹ DEPOSITTRENDS Stable Core Deposit Base Stable Core Deposit Base PFS HISTORICALCOST OFDEPOSITS LBAI HISTORICALCOST OFDEPOSITS 1) Core deposits are total deposits less jumbo time deposits greater than $100,000 34 2) Fed
fund rate represents average rate throughout each period
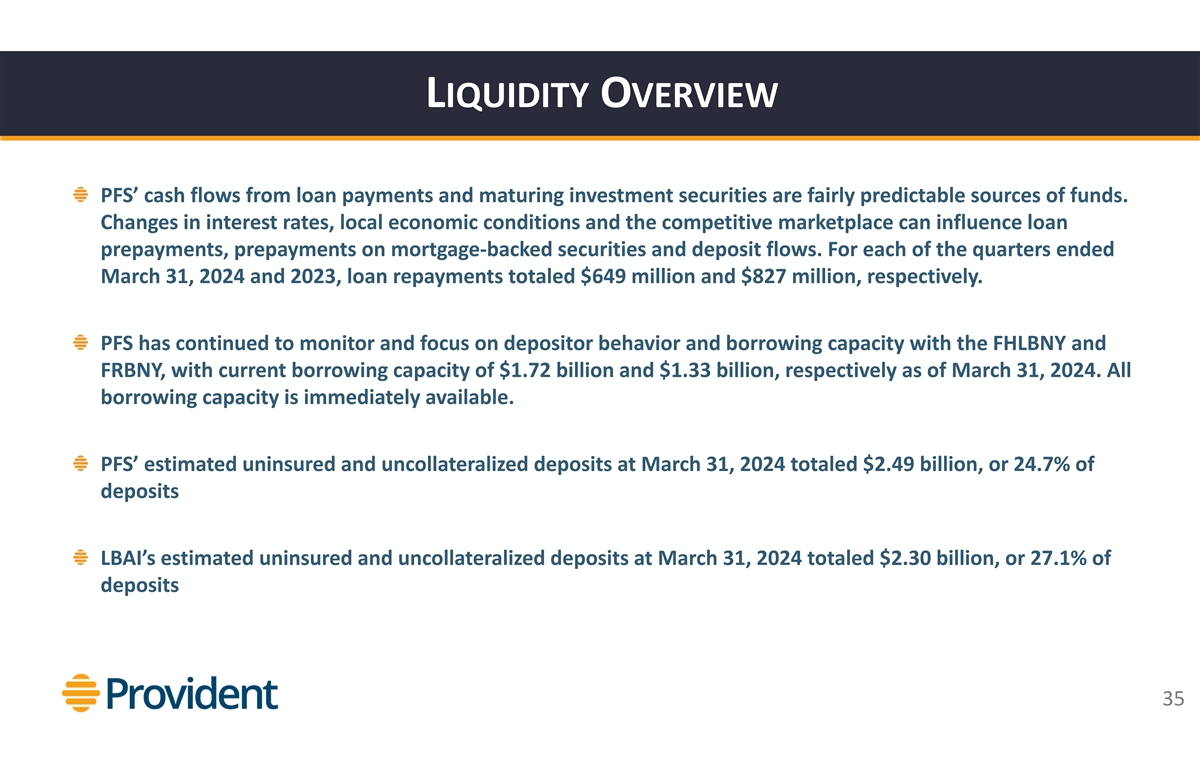
LIQUIDITYOVERVIEW PFS’ cash flows from loan payments and maturing
investment securities are fairly predictable sources of funds. Changes in interest rates, local economic conditions and the competitive marketplace can influence loan prepayments, prepayments on mortgage‐backed securities and deposit flows.
For each of the quarters ended March 31, 2024 and 2023, loan repayments totaled $649 million and $827 million, respectively. PFS has continued to monitor and focus on depositor behavior and borrowing capacity with the FHLBNY and FRBNY, with current
borrowing capacity of $1.72 billion and $1.33 billion, respectively as of March 31, 2024. All borrowing capacity is immediately available. PFS’ estimated uninsured and uncollateralized deposits at March 31, 2024 totaled $2.49 billion, or 24.7%
of deposits LBAI’s estimated uninsured and uncollateralized deposits at March 31, 2024 totaled $2.30 billion, or 27.1% of deposits 35
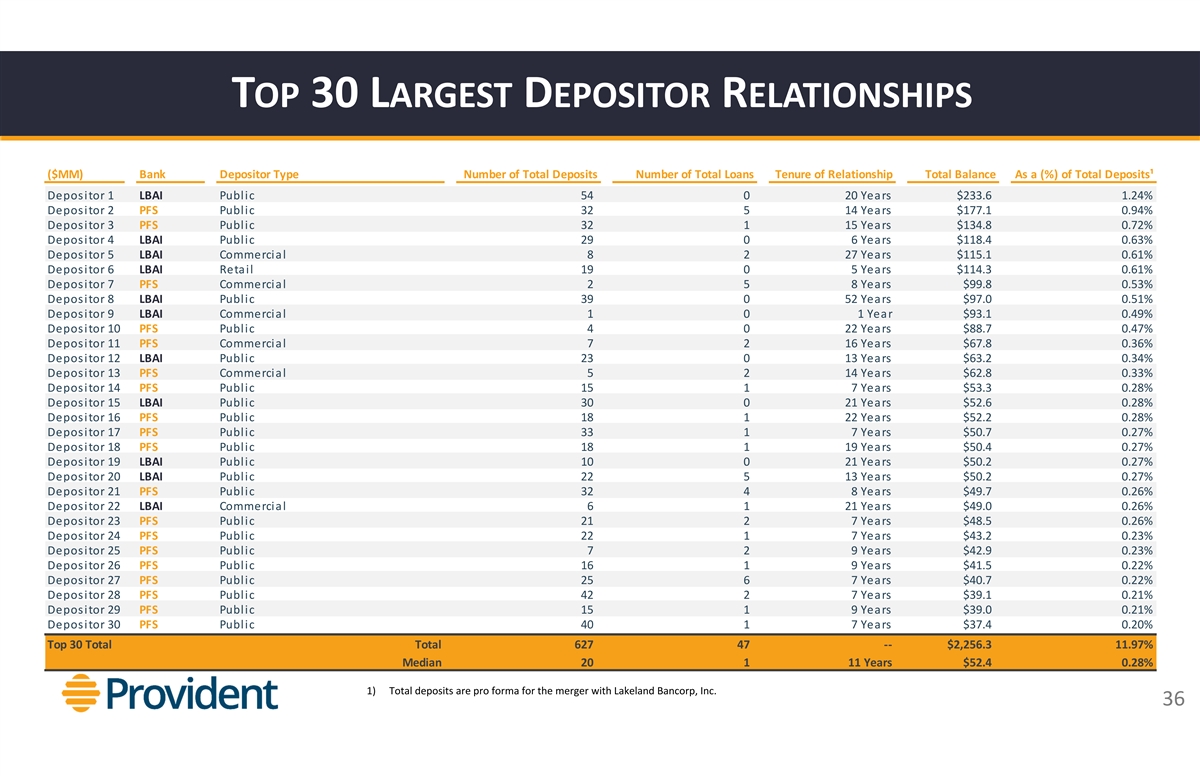
TOP30 LARGESTDEPOSITORRELATIONSHIPS ($MM) Bank Depositor Type Number of
Total Deposits Number of Total Loans Tenure of Relationship Total Balance As a (%) of Total Deposits¹ Depositor 1 LBAI Public 54 0 20 Years $233.6 1.24% Depositor 2 PFS Public 32 5 14 Years $177.1 0.94% Depositor 3 PFS Public 32 1 15 Years
$134.8 0.72% Depositor 4 LBAI Public 29 0 6 Years $118.4 0.63% Depositor 5 LBAI Commercial 8 2 27 Years $115.1 0.61% Depositor 6 LBAI Retail 19 0 5 Years $114.3 0.61% Depositor 7 PFS Commercial 2 5 8 Years $99.8 0.53% Depositor 8 LBAI Public 39 0 52
Years $97.0 0.51% Depositor 9 LBAI Commercial 1 0 1 Year $93.1 0.49% Depositor 10 PFS Public 4 0 22 Years $88.7 0.47% Depositor 11 PFS Commercial 7 2 16 Years $67.8 0.36% Depositor 12 LBAI Public 23 0 13 Years $63.2 0.34% Depositor 13 PFS Commercial
5 2 14 Years $62.8 0.33% Depositor 14 PFS Public 15 1 7 Years $53.3 0.28% Depositor 15 LBAI Public 30 0 21 Years $52.6 0.28% Depositor 16 PFS Public 18 1 22 Years $52.2 0.28% Depositor 17 PFS Public 33 1 7 Years $50.7 0.27% Depositor 18 PFS Public
18 1 19 Years $50.4 0.27% Depositor 19 LBAI Public 10 0 21 Years $50.2 0.27% Depositor 20 LBAI Public 22 5 13 Years $50.2 0.27% Depositor 21 PFS Public 32 4 8 Years $49.7 0.26% Depositor 22 LBAI Commercial 6 1 21 Years $49.0 0.26% Depositor 23 PFS
Public 21 2 7 Years $48.5 0.26% Depositor 24 PFS Public 22 1 7 Years $43.2 0.23% Depositor 25 PFS Public 7 2 9 Years $42.9 0.23% Depositor 26 PFS Public 16 1 9 Years $41.5 0.22% Depositor 27 PFS Public 25 6 7 Years $40.7 0.22% Depositor 28 PFS
Public 42 2 7 Years $39.1 0.21% Depositor 29 PFS Public 15 1 9 Years $39.0 0.21% Depositor 30 PFS Public 40 1 7 Years $37.4 0.20% Top 30 Total Total 627 47 ‐‐ $2,256.3 11.97% Median 20 1 11 Years $52.4 0.28% 1) Total deposits are pro
forma for the merger with Lakeland Bancorp, Inc. 36

CONSERVATIVESECURITIESPORTFOLIO AVAILABLEFORSALESECURITIES($MM)
HELDTOMATURITYSECURITIES($MM) At March 31, 2024, the portfolio had a modified duration of 4.6 years and weighted average life of 5.5 years At March 31, 2024, the allowance for credit losses on held to maturity securities totaled $17,000 $1.7BN
$355MM Q1 2024 AOCI Associated with AFS Portfolio: ($164.4MM) 9.9% of Total AFS Portfolio At March 31, 2024, the portfolio had a modified duration of 6.7 years and weighted average life of 8.1 years At March 31, 2024, the allowance for credit losses
on held to maturity securities totaled $146,000 $914MM $827MM Q1 2024 AOCI Associated with AFS Portfolio: ($66.5MM) 7.3% of Total AFS Portfolio 37 LAKELAND PROVIDENT
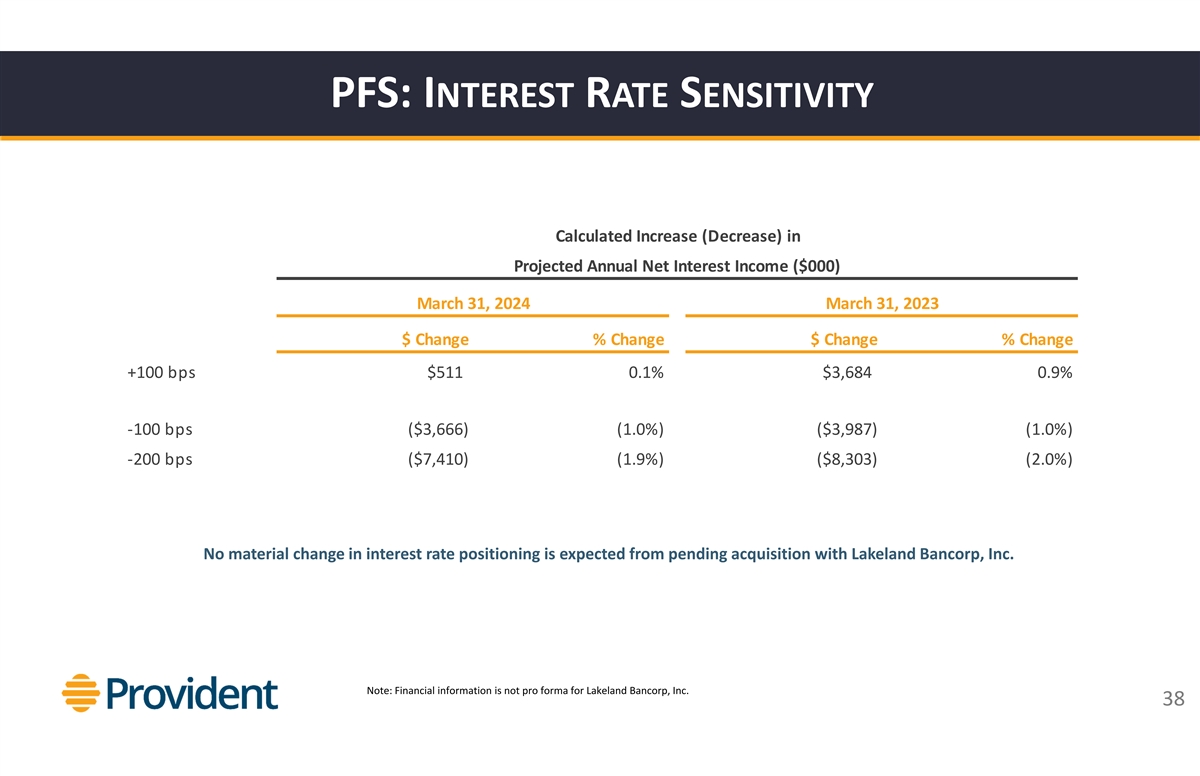
PFS: INTERESTRATESENSITIVITY Calculated Increase (Decrease) in
Projected Annual Net Interest Income ($000) March 31, 2024 March 31, 2023 $ Change % Change $ Change % Change +100 bps $511 0.1% $3,684 0.9% ‐100 bps ($3,666) (1.0%) ($3,987) (1.0%) ‐200 bps ($7,410) (1.9%) ($8,303) (2.0%) No material
change in interest rate positioning is expected from pending acquisition with Lakeland Bancorp, Inc. Note: Financial information is not pro forma for Lakeland Bancorp, Inc. 38
REGULATORYCAPITAL
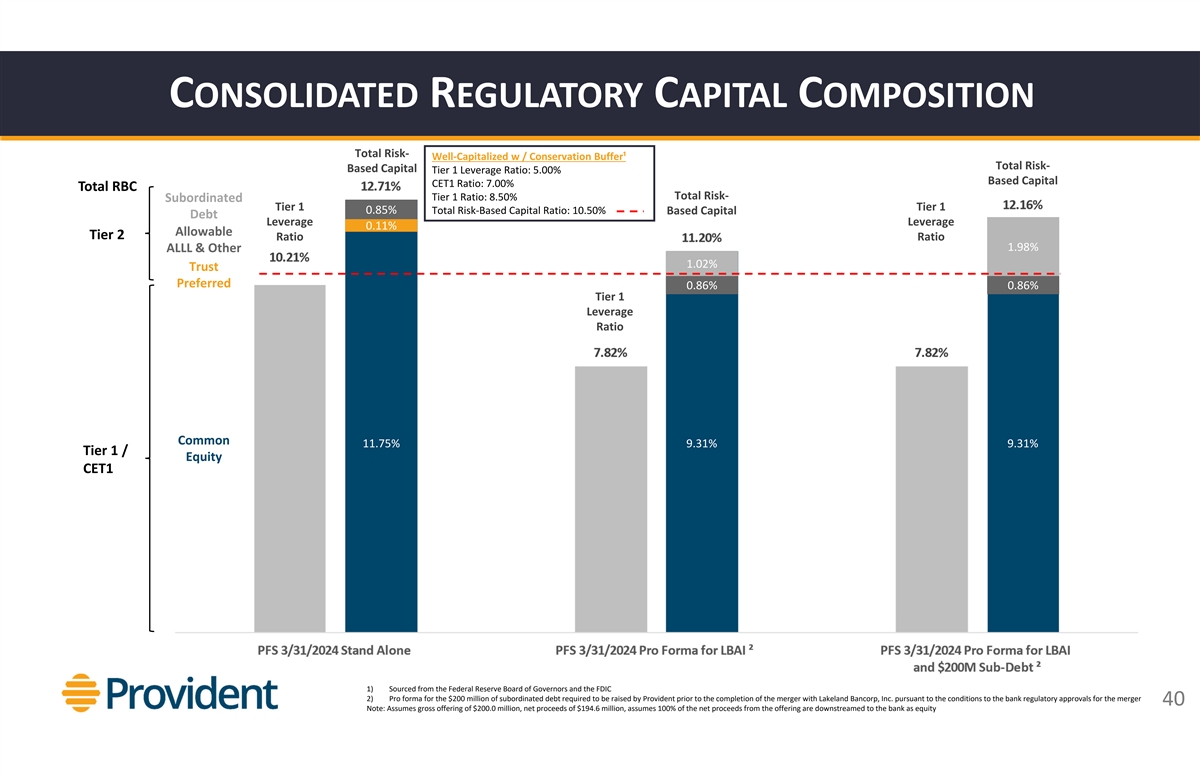
CONSOLIDATEDREGULATORYCAPITALCOMPOSITION Total Risk‐
Well‐Capitalized w / Conservation Buffer¹ Total Risk‐ Based Capital Tier 1 Leverage Ratio: 5.00% Based Capital CET1 Ratio: 7.00% Total RBC Total Risk‐ Tier 1 Ratio: 8.50% Subordinated Tier 1 Tier 1 0.85% Total Risk‐Based
Capital Ratio: 10.50% Based Capital Debt Leverage Leverage 0.11% Allowable Tier 2 Ratio Ratio 1.98% ALLL & Other 1.02% Trust Preferred 0.86% 0.86% Tier 1 Leverage Ratio Common 11.75% 9.31% 9.31% Tier 1 / Equity CET1 1) Sourced from the Federal
Reserve Board of Governors and the FDIC 2) Pro forma for the $200 million of subordinated debt required to be raised by Provident prior to the completion of the merger with Lakeland Bancorp, Inc. pursuant to the conditions to the bank regulatory
approvals for the merger 40 Note: Assumes gross offering of $200.0 million, net proceeds of $194.6 million, assumes 100% of the net proceeds from the offering are downstreamedto the bank as equity
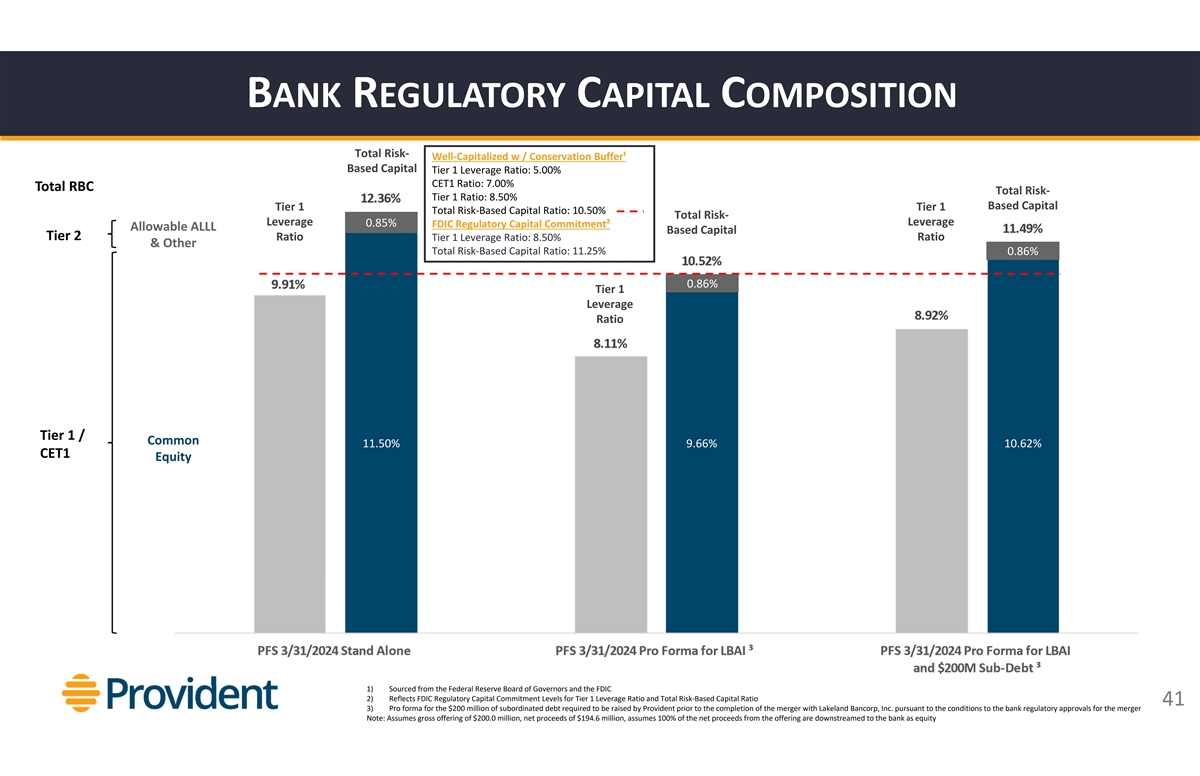
BANKREGULATORYCAPITALCOMPOSITION Total Risk‐
Well‐Capitalized w / Conservation Buffer¹ Based Capital Tier 1 Leverage Ratio: 5.00% CET1 Ratio: 7.00% Total RBC Total Risk‐ Tier 1 Ratio: 8.50% Based Capital Tier 1 Tier 1 Total Risk‐Based Capital Ratio: 10.50% Total
Risk‐ Leverage Leverage 0.85% FDIC Regulatory Capital Commitment² Allowable ALLL Based Capital Tier 2 Ratio Tier 1 Leverage Ratio: 8.50% Ratio & Other Total Risk‐Based Capital Ratio: 11.25% 0.86% 0.86% Tier 1 Leverage Ratio Tier
1 / Common 11.50% 9.66% 10.62% CET1 Equity 1) Sourced from the Federal Reserve Board of Governors and the FDIC 2) Reflects FDIC Regulatory Capital Commitment Levels for Tier 1 Leverage Ratio and Total Risk‐Based Capital Ratio 41 3) Pro forma
for the $200 million of subordinated debt required to be raised by Provident prior to the completion of the merger with Lakeland Bancorp, Inc. pursuant to the conditions to the bank regulatory approvals for the merger Note: Assumes gross offering of
$200.0 million, net proceeds of $194.6 million, assumes 100% of the net proceeds from the offering are downstreamedto the bank as equity
APPENDIX
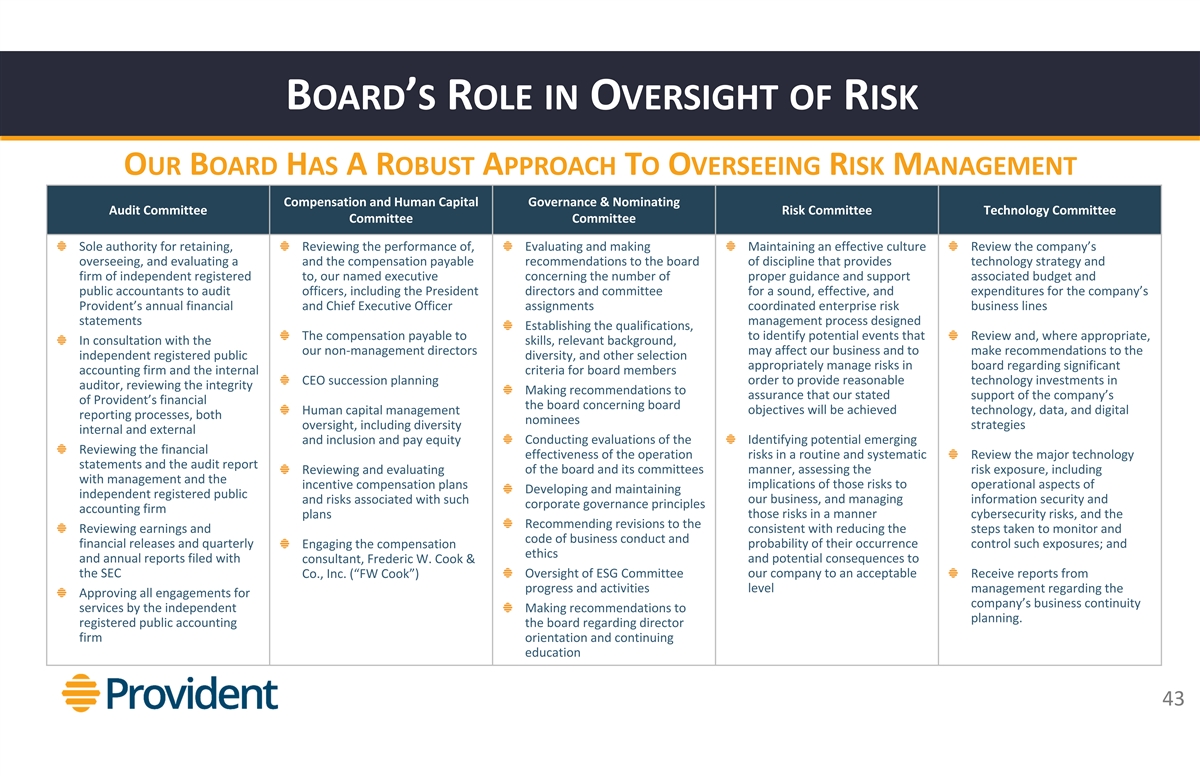
BOARD’SROLE INOVERSIGHT OFRISK OURBOARDHASA
ROBUSTAPPROACHTOOVERSEEINGRISKMANAGEMENT Compensation and HumanCapital Governance & Nominating Audit Committee Risk Committee Technology Committee Committee Committee Sole authority for retaining, Reviewing the performance of, Evaluating and
making Maintaining an effective culture Review the company’s overseeing, and evaluating a and the compensation payable recommendations to the board of discipline that provides technology strategy and firm of independent registered to, our
named executive concerning the number of proper guidance and support associated budget and public accountants to audit officers, including the President directors and committee for a sound, effective, and expenditures for the company’s
Provident’sannual financial and Chief Executive Officer assignments coordinated enterprise risk business lines statements management process designed Establishing the qualifications, The compensation payable to to identify potential events
that Review and, where appropriate, In consultation with the skills, relevant background, our non‐management directors may affect our business and to make recommendations to the independent registered public diversity, and other selection
appropriately manage risks in board regarding significant accounting firm and the internal criteria for board members order to provide reasonable technology investments in CEO succession planning auditor, reviewing the integrity Making
recommendations to assurance that our stated support of the company’s of Provident’sfinancial the board concerning board Human capital management objectives will be achieved technology, data, and digital reporting processes, both
nominees oversight, including diversity strategies internal and external and inclusion and pay equity Conducting evaluations of the Identifying potential emerging Reviewing the financial effectiveness of the operation risks in a routine and
systematic Review the major technology statements and the audit report of the board and its committees manner, assessing the Reviewing and evaluating risk exposure, including with management and the implications of those risks to incentive
compensation plans operational aspects of Developing and maintaining independent registered public and risks associated with such our business, and managing information security and corporate governance principles accounting firm plans those risks
in a manner cybersecurity risks, and the Recommending revisions to the Reviewing earnings and consistent with reducing the steps taken to monitor and code of business conduct and financial releases and quarterly probability of their occurrence
control such exposures; and Engaging the compensation ethics and annual reports filed with and potential consequences to consultant, Frederic W. Cook & the SEC our company to an acceptable Co., Inc. (“FW Cook”) Oversight of ESG
Committee Receive reports from progress and activities level management regarding the Approving all engagements for company’s business continuity services by the independent Making recommendations to planning. registered public accounting the
board regarding director firm orientation and continuing education 43
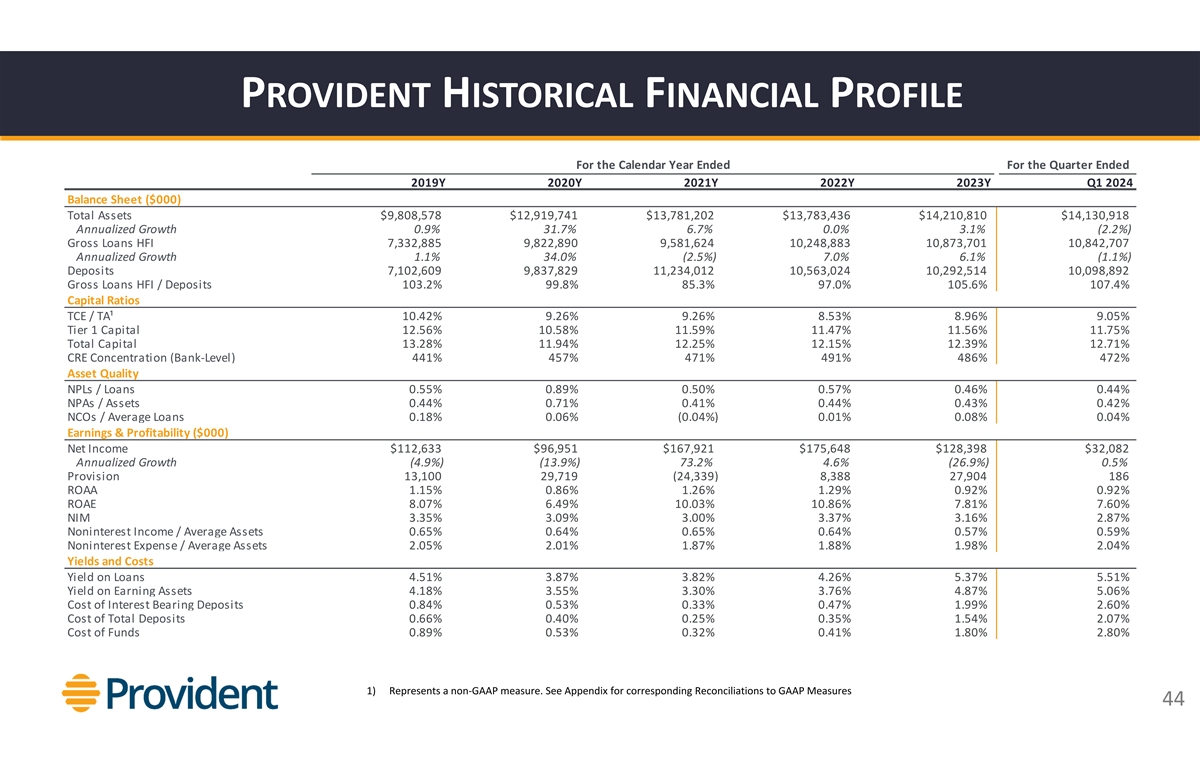
PROVIDENTHISTORICALFINANCIALPROFILE For the Calendar Year Ended For the
Quarter Ended 2019Y 2020Y 2021Y 2022Y 2023Y Q1 2024 Balance Sheet ($000) Total Assets $9,808,578 $12,919,741 $13,781,202 $13,783,436 $14,210,810 $14,130,918 Annualized Growth 0.9% 31.7% 6.7% 0.0% 3.1% (2.2%) Gross Loans HFI 7,332,885 9,822,890
9,581,624 10,248,883 10,873,701 10,842,707 Annualized Growth 1.1% 34.0% (2.5%) 7.0% 6.1% (1.1%) Deposits 7,102,609 9,837,829 11,234,012 10,563,024 10,292,514 10,098,892 Gross Loans HFI / Deposits 103.2% 99.8% 85.3% 97.0% 105.6% 107.4% Capital Ratios
TCE / TA¹ 10.42% 9.26% 9.26% 8.53% 8.96% 9.05% Tier 1 Capital 12.56% 10.58% 11.59% 11.47% 11.56% 11.75% Total Capital 13.28% 11.94% 12.25% 12.15% 12.39% 12.71% CRE Concentration (Bank‐Level) 441% 457% 471% 491% 486% 472% Asset Quality
NPLs / Loans 0.55% 0.89% 0.50% 0.57% 0.46% 0.44% NPAs / Assets 0.44% 0.71% 0.41% 0.44% 0.43% 0.42% NCOs / Average Loans 0.18% 0.06% (0.04%) 0.01% 0.08% 0.04% Earnings & Profitability ($000) Net Income $112,633 $96,951 $167,921 $175,648 $128,398
$32,082 Annualized Growth (4.9%) (13.9%) 73.2% 4.6% (26.9%) 0.5% Provision 13,100 29,719 (24,339) 8,388 27,904 186 ROAA 1.15% 0.86% 1.26% 1.29% 0.92% 0.92% ROAE 8.07% 6.49% 10.03% 10.86% 7.81% 7.60% NIM 3.35% 3.09% 3.00% 3.37% 3.16% 2.87%
Noninterest Income / Average Assets 0.65% 0.64% 0.65% 0.64% 0.57% 0.59% Noninterest Expense / Average Assets 2.05% 2.01% 1.87% 1.88% 1.98% 2.04% Yields and Costs Yield on Loans 4.51% 3.87% 3.82% 4.26% 5.37% 5.51% Yield on Earning Assets 4.18% 3.55%
3.30% 3.76% 4.87% 5.06% Cost of Interest Bearing Deposits 0.84% 0.53% 0.33% 0.47% 1.99% 2.60% Cost of Total Deposits 0.66% 0.40% 0.25% 0.35% 1.54% 2.07% Cost of Funds 0.89% 0.53% 0.32% 0.41% 1.80% 2.80% 1) Represents a non‐GAAP measure. See
Appendix for corresponding Reconciliations to GAAP Measures 44
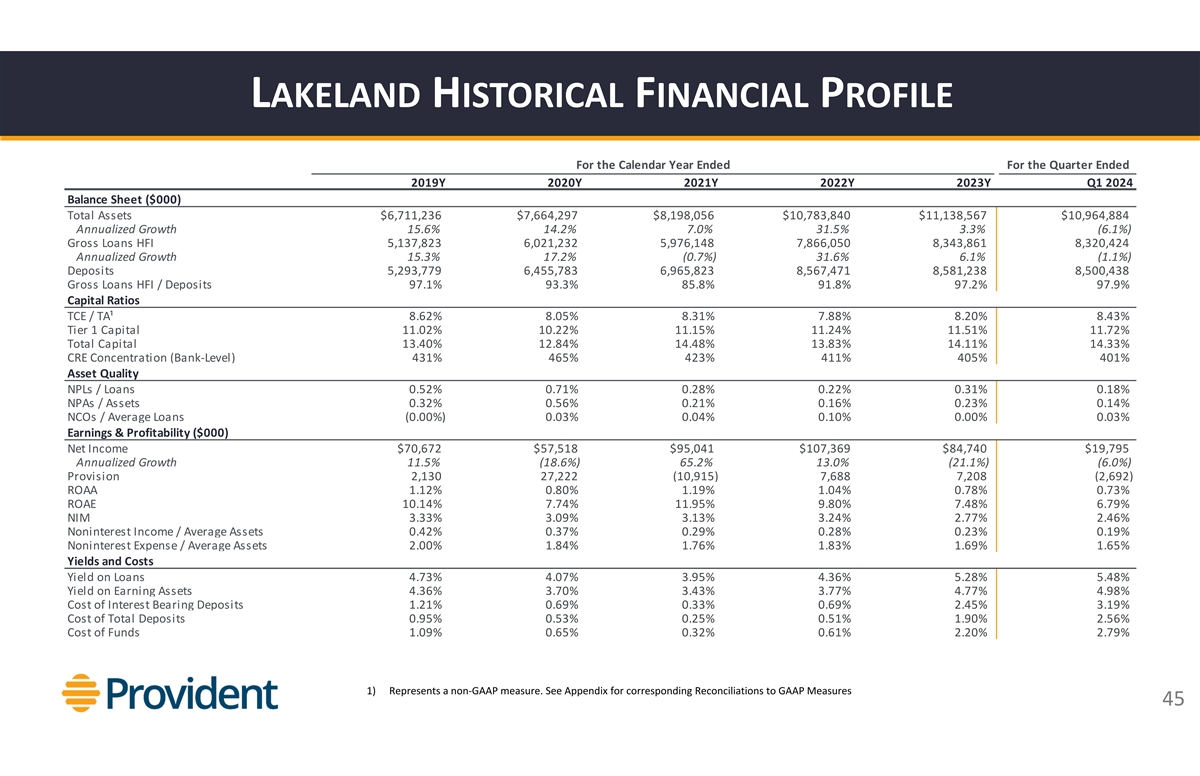
LAKELANDHISTORICALFINANCIALPROFILE For the Calendar Year Ended For the
Quarter Ended 2019Y 2020Y 2021Y 2022Y 2023Y Q1 2024 Balance Sheet ($000) Total Assets $6,711,236 $7,664,297 $8,198,056 $10,783,840 $11,138,567 $10,964,884 Annualized Growth 15.6% 14.2% 7.0% 31.5% 3.3% (6.1%) Gross Loans HFI 5,137,823 6,021,232
5,976,148 7,866,050 8,343,861 8,320,424 Annualized Growth 15.3% 17.2% (0.7%) 31.6% 6.1% (1.1%) Deposits 5,293,779 6,455,783 6,965,823 8,567,471 8,581,238 8,500,438 Gross Loans HFI / Deposits 97.1% 93.3% 85.8% 91.8% 97.2% 97.9% Capital Ratios TCE /
TA¹ 8.62% 8.05% 8.31% 7.88% 8.20% 8.43% Tier 1 Capital 11.02% 10.22% 11.15% 11.24% 11.51% 11.72% Total Capital 13.40% 12.84% 14.48% 13.83% 14.11% 14.33% CRE Concentration (Bank‐Level) 431% 465% 423% 411% 405% 401% Asset Quality NPLs /
Loans 0.52% 0.71% 0.28% 0.22% 0.31% 0.18% NPAs / Assets 0.32% 0.56% 0.21% 0.16% 0.23% 0.14% NCOs / Average Loans (0.00%) 0.03% 0.04% 0.10% 0.00% 0.03% Earnings & Profitability ($000) Net Income $70,672 $57,518 $95,041 $107,369 $84,740 $19,795
Annualized Growth 11.5% (18.6%) 65.2% 13.0% (21.1%) (6.0%) Provision 2,130 27,222 (10,915) 7,688 7,208 (2,692) ROAA 1.12% 0.80% 1.19% 1.04% 0.78% 0.73% ROAE 10.14% 7.74% 11.95% 9.80% 7.48% 6.79% NIM 3.33% 3.09% 3.13% 3.24% 2.77% 2.46% Noninterest
Income / Average Assets 0.42% 0.37% 0.29% 0.28% 0.23% 0.19% Noninterest Expense / Average Assets 2.00% 1.84% 1.76% 1.83% 1.69% 1.65% Yields and Costs Yield on Loans 4.73% 4.07% 3.95% 4.36% 5.28% 5.48% Yield on Earning Assets 4.36% 3.70% 3.43% 3.77%
4.77% 4.98% Cost of Interest Bearing Deposits 1.21% 0.69% 0.33% 0.69% 2.45% 3.19% Cost of Total Deposits 0.95% 0.53% 0.25% 0.51% 1.90% 2.56% Cost of Funds 1.09% 0.65% 0.32% 0.61% 2.20% 2.79% 1) Represents a non‐GAAP measure. See Appendix for
corresponding Reconciliations to GAAP Measures 45

PROVIDENTNOTES ANDRECONCILIATION OFGAAP ANDNON‐GAAP
FINANCIALMEASURES (DOLLARS INTHOUSANDS, EXCEPT SHARE DATA) The Company has presented the following non‐GAAP (U.S. Generally Accepted Accounting Principles) financial measures because it believes that these measures provide useful and
comparative information to assess trends in the Company’s results of operations and financial condition. Presentation of these non‐GAAP financial measures is consistent with how the Company evaluates its performance internally and these
non‐GAAP financial measures are frequently used by securities analysts, investors and other interested parties in the evaluation of companies in the Company’s industry. Investors should recognize that the Company’s presentation of
these non‐GAAP financial measures might not be comparable to similarly‐titled measures of other companies. Thesenon‐GAAP financial measuresshould notbeconsidered asubstituteforGAAPbasis measuresand
theCompanystronglyencouragesareviewofitscondensed consolidated financial statementsintheirentirety. 2019Y 2020Y 2021Y 2022Y 2023Y Q1 2024 Efficienc y ratio calculation: Net Interest income $297,973 $312,570 $366,023 $417,552 $399,454 $93,670
Non‐interest income 63,794 72,431 86,809 87,789 79,829 20,807 Total income $361,767 $385,001 $452,832 $505,341 $479,283 $114,477 Reported non‐interest expense $201,579 $227,728 $250,053 $256,847 $275,600 $71,321 Adjustments to
non‐interest expense: Credit loss expense for off‐balance sheet credit exposures ‐ 1,814 1,515 (3,384) 264 (506) Merger‐related transaction costs, COVID‐19 expenses & contingent litigation reserves 2,768 7,697
‐ 4,128 10,826 2,502 Adjusted non‐interest expense $198,811 $218,217 $248,538 $256,103 $264,510 $69,325 Efficiency ratio (Adjusted non‐interest expense/income) 54.96% 56.68% 54.89% 50.68% 55.19% 60.56% 2019Y 2020Y 2021Y 2022Y 2023Y
Q1 2024 Return on average tangible common equity: Net income $112,633 $96,951 $167,921 $175,648 $128,398 $32,082 Average stockholders' equity $1,394,859 $1,494,563 $1,673,715 $1,618,090 $1,644,529 $1,698,170 Less: average intangible assets 433,189
449,711 465,214 462,620 459,503 457,695 Average tangible stockholders' equity $961,670 $1,044,852 $1,208,501 $1,155,470 $1,185,026 $1,240,475 ROATE (Annualized net income/average tangible stockholders' equity) 11.71% 9.28% 13.89% 15.20% 10.84%
10.40% 2019Y 2020Y 2021Y 2022Y 2023Y Q1 2024 Tangible Common Equity / Tangible Assets: Stockholders' equity $1,413,840 $1,619,797 $1,697,096 $1,597,703 $1,690,596 $1,695,162 Less: intangible assets 437,019 466,212 464,183 460,892 457,942 457,239
Tangible stockholders' equity $976,821 $1,153,585 $1,232,913 $1,136,811 $1,232,654 $1,237,923 Total Assets $9,808,578 $12,919,741 $13,781,202 $13,783,436 $14,210,810 $14,130,918 Less: intangible assets 437,019 466,212 464,183 460,892 457,942 457,239
Tangible assets $9,371,559 $12,453,529 $13,317,019 $13,322,544 $13,752,868 $13,673,679 Tangible Common Equity / Tangible Assets 10.42% 9.26% 9.26% 8.53% 8.96% 9.05% 2019Y 2020Y 2021Y 2022Y 2023Y Q1 2024 Tangible book value per share: Stockholders'
equity $1,413,840 $1,619,797 $1,697,096 $1,597,703 $1,690,596 $1,695,162 Less: intangible assets 437,019 466,212 464,183 460,892 457,942 457,239 Tangible stockholders' equity $976,821 $1,153,585 $1,232,913 $1,136,811 $1,232,654 $1,237,923 Shares
outstanding 65,787,900 77,611,107 76,969,999 75,169,196 75,537,186 75,928,193 Tangible book value per share (Tangible stockholders' equity/shares outstanding) $14.85 $14.86 $16.02 $15.12 $16.32 $16.30 46
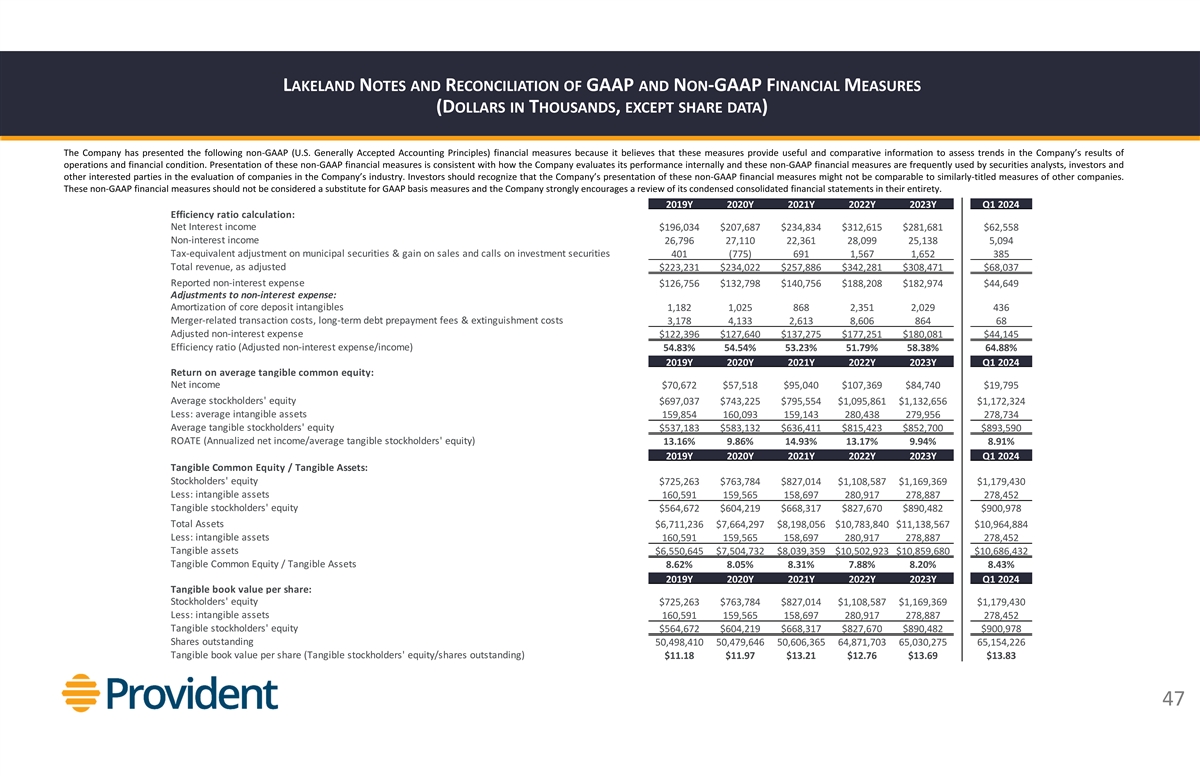
LAKELANDNOTES ANDRECONCILIATION OFGAAP ANDNON‐GAAP
FINANCIALMEASURES (DOLLARS INTHOUSANDS, EXCEPT SHARE DATA) The Company has presented the following non‐GAAP (U.S. Generally Accepted Accounting Principles) financial measures because it believes that these measures provide useful and
comparative information to assess trends in the Company’s results of operations and financial condition. Presentation of these non‐GAAP financial measures is consistent with how the Company evaluates its performance internally and these
non‐GAAP financial measures are frequently used by securities analysts, investors and other interested parties in the evaluation of companies in the Company’s industry. Investors should recognize that the Company’s presentation of
these non‐GAAP financial measures might not be comparable to similarly‐titled measures of other companies. Thesenon‐GAAP financial measuresshould notbeconsidered asubstituteforGAAPbasis measuresand
theCompanystronglyencouragesareviewofitscondensed consolidated financial statementsintheirentirety. 2019Y 2020Y 2021Y 2022Y 2023Y Q1 2024 Efficiency ratio calculation: Net Interest income $196,034 $207,687 $234,834 $312,615 $281,681 $62,558
Non‐interest income 26,796 27,110 22,361 28,099 25,138 5,094 Tax‐equivalent adjustment on municipal securities & gain on sales and calls on investment securities 401 (775) 691 1,567 1,652 385 Total revenue, as adjusted $223,231
$234,022 $257,886 $342,281 $308,471 $68,037 Reported non‐interest expense $126,756 $132,798 $140,756 $188,208 $182,974 $44,649 Adjustments to non‐interest expense: Amortization of core deposit intangibles 1,182 1,025 868 2,351 2,029 436
Merger‐related transaction costs, long‐term debt prepayment fees & extinguishment costs 3,178 4,133 2,613 8,606 864 68 Adjusted non‐interest expense $122,396 $127,640 $137,275 $177,251 $180,081 $44,145 Efficiency ratio
(Adjusted non‐interest expense/income) 54.83% 54.54% 53.23% 51.79% 58.38% 64.88% 2019Y 2020Y 2021Y 2022Y 2023Y Q1 2024 Return on average tangible common equity: Net income $70,672 $57,518 $95,040 $107,369 $84,740 $19,795 Average stockholders'
equity $697,037 $743,225 $795,554 $1,095,861 $1,132,656 $1,172,324 Less: average intangible assets 159,854 160,093 159,143 280,438 279,956 278,734 Average tangible stockholders' equity $537,183 $583,132 $636,411 $815,423 $852,700 $893,590 ROATE
(Annualized net income/average tangible stockholders' equity) 13.16% 9.86% 14.93% 13.17% 9.94% 8.91% 2019Y 2020Y 2021Y 2022Y 2023Y Q1 2024 Tangible Common Equity / Tangible Assets: Stockholders' equity $725,263 $763,784 $827,014 $1,108,587
$1,169,369 $1,179,430 Less: intangible assets 160,591 159,565 158,697 280,917 278,887 278,452 Tangible stockholders' equity $564,672 $604,219 $668,317 $827,670 $890,482 $900,978 Total Assets $6,711,236 $7,664,297 $8,198,056 $10,783,840 $11,138,567
$10,964,884 Less: intangible assets 160,591 159,565 158,697 280,917 278,887 278,452 Tangible assets $6,550,645 $7,504,732 $8,039,359 $10,502,923 $10,859,680 $10,686,432 Tangible Common Equity / Tangible Assets 8.62% 8.05% 8.31% 7.88% 8.20% 8.43%
2019Y 2020Y 2021Y 2022Y 2023Y Q1 2024 Tangible book value per share: Stockholders' equity $725,263 $763,784 $827,014 $1,108,587 $1,169,369 $1,179,430 Less: intangible assets 160,591 159,565 158,697 280,917 278,887 278,452 Tangible stockholders'
equity $564,672 $604,219 $668,317 $827,670 $890,482 $900,978 Shares outstanding 50,498,410 50,479,646 50,606,365 64,871,703 65,030,275 65,154,226 Tangible book value per share (Tangible stockholders' equity/shares outstanding) $11.18 $11.97 $13.21
$12.76 $13.69 $13.83 47
v3.24.1.u1
| X |
- DefinitionBoolean flag that is true when the XBRL content amends previously-filed or accepted submission.
| Name: |
dei_AmendmentFlag |
| Namespace Prefix: |
dei_ |
| Data Type: |
xbrli:booleanItemType |
| Balance Type: |
na |
| Period Type: |
duration |
|
| X |
- DefinitionFor the EDGAR submission types of Form 8-K: the date of the report, the date of the earliest event reported; for the EDGAR submission types of Form N-1A: the filing date; for all other submission types: the end of the reporting or transition period. The format of the date is YYYY-MM-DD.
| Name: |
dei_DocumentPeriodEndDate |
| Namespace Prefix: |
dei_ |
| Data Type: |
xbrli:dateItemType |
| Balance Type: |
na |
| Period Type: |
duration |
|
| X |
- DefinitionThe type of document being provided (such as 10-K, 10-Q, 485BPOS, etc). The document type is limited to the same value as the supporting SEC submission type, or the word 'Other'.
| Name: |
dei_DocumentType |
| Namespace Prefix: |
dei_ |
| Data Type: |
dei:submissionTypeItemType |
| Balance Type: |
na |
| Period Type: |
duration |
|
| X |
- DefinitionAddress Line 1 such as Attn, Building Name, Street Name
| Name: |
dei_EntityAddressAddressLine1 |
| Namespace Prefix: |
dei_ |
| Data Type: |
xbrli:normalizedStringItemType |
| Balance Type: |
na |
| Period Type: |
duration |
|
| X |
- Definition
+ References
+ Details
| Name: |
dei_EntityAddressCityOrTown |
| Namespace Prefix: |
dei_ |
| Data Type: |
xbrli:normalizedStringItemType |
| Balance Type: |
na |
| Period Type: |
duration |
|
| X |
- DefinitionCode for the postal or zip code
| Name: |
dei_EntityAddressPostalZipCode |
| Namespace Prefix: |
dei_ |
| Data Type: |
xbrli:normalizedStringItemType |
| Balance Type: |
na |
| Period Type: |
duration |
|
| X |
- DefinitionName of the state or province.
| Name: |
dei_EntityAddressStateOrProvince |
| Namespace Prefix: |
dei_ |
| Data Type: |
dei:stateOrProvinceItemType |
| Balance Type: |
na |
| Period Type: |
duration |
|
| X |
- DefinitionA unique 10-digit SEC-issued value to identify entities that have filed disclosures with the SEC. It is commonly abbreviated as CIK. Reference 1: http://www.xbrl.org/2003/role/presentationRef
-Publisher SEC
-Name Exchange Act
-Number 240
-Section 12
-Subsection b-2
| Name: |
dei_EntityCentralIndexKey |
| Namespace Prefix: |
dei_ |
| Data Type: |
dei:centralIndexKeyItemType |
| Balance Type: |
na |
| Period Type: |
duration |
|
| X |
- DefinitionIndicate if registrant meets the emerging growth company criteria. Reference 1: http://www.xbrl.org/2003/role/presentationRef
-Publisher SEC
-Name Exchange Act
-Number 240
-Section 12
-Subsection b-2
| Name: |
dei_EntityEmergingGrowthCompany |
| Namespace Prefix: |
dei_ |
| Data Type: |
xbrli:booleanItemType |
| Balance Type: |
na |
| Period Type: |
duration |
|
| X |
- DefinitionCommission file number. The field allows up to 17 characters. The prefix may contain 1-3 digits, the sequence number may contain 1-8 digits, the optional suffix may contain 1-4 characters, and the fields are separated with a hyphen.
| Name: |
dei_EntityFileNumber |
| Namespace Prefix: |
dei_ |
| Data Type: |
dei:fileNumberItemType |
| Balance Type: |
na |
| Period Type: |
duration |
|
| X |
- DefinitionTwo-character EDGAR code representing the state or country of incorporation.
| Name: |
dei_EntityIncorporationStateCountryCode |
| Namespace Prefix: |
dei_ |
| Data Type: |
dei:edgarStateCountryItemType |
| Balance Type: |
na |
| Period Type: |
duration |
|
| X |
- DefinitionThe exact name of the entity filing the report as specified in its charter, which is required by forms filed with the SEC. Reference 1: http://www.xbrl.org/2003/role/presentationRef
-Publisher SEC
-Name Exchange Act
-Number 240
-Section 12
-Subsection b-2
| Name: |
dei_EntityRegistrantName |
| Namespace Prefix: |
dei_ |
| Data Type: |
xbrli:normalizedStringItemType |
| Balance Type: |
na |
| Period Type: |
duration |
|
| X |
- DefinitionThe Tax Identification Number (TIN), also known as an Employer Identification Number (EIN), is a unique 9-digit value assigned by the IRS. Reference 1: http://www.xbrl.org/2003/role/presentationRef
-Publisher SEC
-Name Exchange Act
-Number 240
-Section 12
-Subsection b-2
| Name: |
dei_EntityTaxIdentificationNumber |
| Namespace Prefix: |
dei_ |
| Data Type: |
dei:employerIdItemType |
| Balance Type: |
na |
| Period Type: |
duration |
|
| X |
- DefinitionLocal phone number for entity.
| Name: |
dei_LocalPhoneNumber |
| Namespace Prefix: |
dei_ |
| Data Type: |
xbrli:normalizedStringItemType |
| Balance Type: |
na |
| Period Type: |
duration |
|
| X |
- DefinitionBoolean flag that is true when the Form 8-K filing is intended to satisfy the filing obligation of the registrant as pre-commencement communications pursuant to Rule 13e-4(c) under the Exchange Act. Reference 1: http://www.xbrl.org/2003/role/presentationRef
-Publisher SEC
-Name Exchange Act
-Number 240
-Section 13e
-Subsection 4c
| Name: |
dei_PreCommencementIssuerTenderOffer |
| Namespace Prefix: |
dei_ |
| Data Type: |
xbrli:booleanItemType |
| Balance Type: |
na |
| Period Type: |
duration |
|
| X |
- DefinitionBoolean flag that is true when the Form 8-K filing is intended to satisfy the filing obligation of the registrant as pre-commencement communications pursuant to Rule 14d-2(b) under the Exchange Act. Reference 1: http://www.xbrl.org/2003/role/presentationRef
-Publisher SEC
-Name Exchange Act
-Number 240
-Section 14d
-Subsection 2b
| Name: |
dei_PreCommencementTenderOffer |
| Namespace Prefix: |
dei_ |
| Data Type: |
xbrli:booleanItemType |
| Balance Type: |
na |
| Period Type: |
duration |
|
| X |
- DefinitionTitle of a 12(b) registered security. Reference 1: http://www.xbrl.org/2003/role/presentationRef
-Publisher SEC
-Name Exchange Act
-Number 240
-Section 12
-Subsection b
| Name: |
dei_Security12bTitle |
| Namespace Prefix: |
dei_ |
| Data Type: |
dei:securityTitleItemType |
| Balance Type: |
na |
| Period Type: |
duration |
|
| X |
- DefinitionName of the Exchange on which a security is registered. Reference 1: http://www.xbrl.org/2003/role/presentationRef
-Publisher SEC
-Name Exchange Act
-Number 240
-Section 12
-Subsection d1-1
| Name: |
dei_SecurityExchangeName |
| Namespace Prefix: |
dei_ |
| Data Type: |
dei:edgarExchangeCodeItemType |
| Balance Type: |
na |
| Period Type: |
duration |
|
| X |
- DefinitionBoolean flag that is true when the Form 8-K filing is intended to satisfy the filing obligation of the registrant as soliciting material pursuant to Rule 14a-12 under the Exchange Act. Reference 1: http://www.xbrl.org/2003/role/presentationRef
-Publisher SEC
-Name Exchange Act
-Section 14a
-Number 240
-Subsection 12
| Name: |
dei_SolicitingMaterial |
| Namespace Prefix: |
dei_ |
| Data Type: |
xbrli:booleanItemType |
| Balance Type: |
na |
| Period Type: |
duration |
|
| X |
- DefinitionTrading symbol of an instrument as listed on an exchange.
| Name: |
dei_TradingSymbol |
| Namespace Prefix: |
dei_ |
| Data Type: |
dei:tradingSymbolItemType |
| Balance Type: |
na |
| Period Type: |
duration |
|
| X |
- DefinitionBoolean flag that is true when the Form 8-K filing is intended to satisfy the filing obligation of the registrant as written communications pursuant to Rule 425 under the Securities Act. Reference 1: http://www.xbrl.org/2003/role/presentationRef
-Publisher SEC
-Name Securities Act
-Number 230
-Section 425
| Name: |
dei_WrittenCommunications |
| Namespace Prefix: |
dei_ |
| Data Type: |
xbrli:booleanItemType |
| Balance Type: |
na |
| Period Type: |
duration |
|
Provident Financial Serv... (NYSE:PFS)
Historical Stock Chart
From Apr 2024 to May 2024

Provident Financial Serv... (NYSE:PFS)
Historical Stock Chart
From May 2023 to May 2024
