 PURA VIDA
4 years ago
PURA VIDA
4 years ago
It is getting hilarious now. Look at those idiotic MM's trying to suck people back in. Corrupt asswipes. They are inching it up on VERY LITTLE volume, because it is quite obvious by this board and the volume - not too many people even know about this company. The MM's are corrupt as hell as well on this ticker, so if you get in, be careful..... because there is not enough retail interest to fight the corrupt bastards. They EASILY put it anywhere they want, and once they get enough people (suckers) in, they move it right back down.
PURA VIDA
4 years ago
Alrighty now.... MM's filled the damn gap at 2.81 and actually ran it down to 2.72
Today the company announced record production, record profits and the best AISC that they have ever had with the goals to reach full forecasts for the year and incredible profit margins. Gold is up over $24 per ounce - yet - MM's driving the price down further again.
GO FIGURE !!
-- Record second quarter 2021 consolidated gold production of 29,831 ounces
and gold sales of 30,412 ounces was ahead of budget, positioning the
Corporation well to deliver 2021 guidance. Full year consolidated 2021
gold production guidance of 105,000 to 115,000 ounces is maintained
(assumes no significant interruption to operations as a result of the
COVID-19 virus).
-- Second quarter 2021 consolidated all-in-sustaining-costs ("AISC")1 of
US$996 per ounce was on track with the full year 2021 guided range of
US$985-$1,085 per ounce and a 5% reduction, or US$53 per ounce, compared
to first quarter AISC of US$1,049 per ounce.
-- Adjusted earnings1 of $14.3 million, or $0.10 per share for the second
quarter of 2021, up $11.6 million from $2.7 million in the second quarter
of 2020 and up $6.2 million (or $0.04 per share) compared to the first
quarter of 2021.
-- Adjusted EBITDA1 was $29.5 million or $0.20 per share for the second
quarter of 2021, up $9.2 million from $20.3 million in the second quarter
of 2020 and up $8.3 million from $21.2 million in the first quarter of
2021.
-- Cash flow from operating activities of $26.4 million, an 18% increase
compared to $22.3 million for the second quarter of 2020 and up $7.7
million (or $0.05 per share) compared to the first quarter of 2021.
-- Karora ended the second quarter of 2021 with a strong cash position of
$82.2 million and working capital of $64.8 million, higher by $5.5
million and $1.6 million, respectively, from March 31, 2021.
-- On June 28, 2021 the Corporation announced a multi-year growth plan
funded through operating cash flows and current cash balance. Three-year
production and cost guidance will approximately double consolidated gold
production to 185,000 -- 205,000 ounces by 2024 at an AISC of
US$885-US$985 per ounce. The growth plan includes a significant expansion
of Beta Hunt to increase underground production to 2.0 million tonnes per
annum ("Mtpa") by 2024 through the addition of a second decline.
-- The three year growth plan includes a Phase II expansion of the
Higginsville processing plant, increasing throughput to 2.5 Mtpa by 2024.
A Phase I expansion to 1.6 Mtpa from 1.4 Mtpa is currently underway.
-- Karora announced a new high grade nickel discovery at Beta Hunt, the
second in the last six months, known as the Gamma Zone - 50C, where 11.6%
nickel over 4.6 metres, including 18.4% nickel over 2.2 metres was
intersected in hole G50-22-005E. Drilling also intersected gold
mineralization above and below the 50C trough and indicates the Beta Hunt
gold mineralized system extends for over 3.5 kilometres of strike from
the northern end of the A Zone (See Karora news release dated April 6,
2021). Follow up drilling is ongoing as part of a new dedicated nickel
exploration unit established at Beta Hunt during the second quarter.
 geodan
4 years ago
geodan
4 years ago
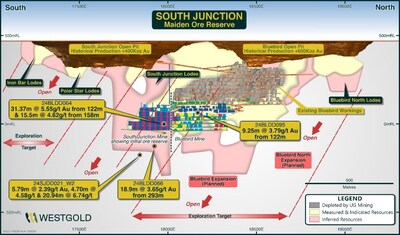
14.4.5.1. Two Boys Location, Mineral Resource and past production
The Two Boys deposit lies 800m south of the HGO gold processing facility. It consists of several narrow shear and quartz vein structures and had a high-grade shallowly north-dipping quartz vein lode which was mined by Barminco from 1997 to May 1998 by decline and room and pillar stoping. The most prominent surface feature is the Barminco box cut for the portal of the decline.
It produced 185,000t at 14.0 g/t for total recovered 82,063 oz
Very extensive info on Two Boys in new Tech Report , includes pics of 5 foot quartz vein with low dip angle which means shallow mining gets a lot more ore than steep dip.
Gold is often visible occurring as coarse gold grains up to several millimetres in diameter (Sheddon 1998) and often occurring
with pyrite, arsenopyrite and galena (Westgold 2018).
https://www.karoraresources.com/download/KRR+43-101+Technical+Report+%281+Feb+2021%29+FINAL.pdf page 240
Average grade in past underground was 14 grams. If it is half that good in future being they were able to open this mine so fast means capital costs were tiny and it is less than 1 KM from mill. Discussed fair amount in this new video by Huet
geodan
4 years ago
New PR Gold: The five drill holes designed to test for nickel mineralization also returned encouraging gold intersections south of the Gamma Island Fault, occurring both in the underlying footwall basalt (same environment that hosts both the A Zone and Western Flanks Mineral Resources), and the overlying ultramafic. The association of gold mineralization with the ultramafic is not typical of the Beta Hunt gold mineralized system and requires further study to understand the significance of this observation.
The confirmation of gold mineralization south of the Gamma Island Fault extends the Beta Hunt gold system over a 3.5 kilometre strike length from the northern end of A zone and indicates potential for the continued growth of the existing gold Mineral Resource. Significant gold intersections1.include:
G50-22-002E: 2.7g/t over 12.0 meters, including 10.1g/t over 1.4 meters
G50-22-005E: 5.2 g/t over 3.2 meters
G50-22-004E: 2.8g/t over 11.5 meters, including 10.5 g/t over 0.5 meters
G50-22-003E: 4.2g/t over 2.0 meters So they drill for gold and find gold at Larkin zone and they hit bonanza grade nickel by accident (over $1,000 a ton) then they drill for more of that bonanza grade nickel in another part of mine and they find even richer nickel, and new ore body of nickel, yet accidentally find gold where it should not be. This is called having good luck.
 ConferredDiligence
4 years ago
ConferredDiligence
4 years ago
Yes, I to saw it going on before the R/S, some days over 75% of volume was being hidden on the dark exchanges. After the R/S closed KRR traded normally for the first few weeks and had some nice gains with only about 20-25% of the volume being redirected to dark exchanges (IMO this was not just coincidence). As time went on though, this percentage began to climb again to the levels we were at before the split and the SP began to decline, I suspect it took a few weeks for the mm's to regain control after the split and name change, it seems they are now once again firmly entrenched. The R/S split and lower float was supposed to put a stop to this manipulation and add institutional ownership, I've seen no proof of either. Paul Huet as CEO has got to know who the guilty parties are...he may even be directing them.
ConferredDiligence
4 years ago
Closing right at the lows of Friday's stellar ER, right where the manipulators wanted it all along, they won't even leave a penny on the table, there will be no gains allowed for positive news or ER's....never has been in almost 3 years, after all that has transpired, still trading like a lowly penny stock. I gave up 80% of my shares for this R/S and we are still trading at that same level, we can't even gain a few pennies for the extra 30 million in cash since then. I would much rather have all my shares back and be fighting for every penny than to be at 3.44 minus 80% of my shares still fighting for that same penny, this continued SP suppression has become beyond ridiculous! This company has a fiduciary responsibility to it's shareholders and has failed to rein in it's mm's or support the share price in a meaningful manner with the buyback program.
 ~ Blue ~
4 years ago
~ Blue ~
4 years ago
Karora Announces 21% Increase in Production Guidance for 2021 Following Record Annual Production of 99,249 ounces, Beating 2020 Guidance
Karora achieves record gold production of 99,249 ounces and gold sales of 98,646 ounces in 2020
Year-end consolidated cash balance of C$79.5 million, an 18% increase vs. the third quarter, net of a $2 million early debt repayment during the fourth quarter.
https://finance.yahoo.com/news/government-canada-supports-climate-action-203200470.html
Bu33ard
4 years ago
LOL, I waited... Not much action on this board is there.
Just spent a few hours on the financials and qtrlys of this little gem. It appears to be under valued by a fair amount.
There is the little time bomb of 8.1 mil shares that Eric S. and the ubiquitous "Unnamed Investor" are able to dump in the market on/after Nov. 17th 2020. But, presumably, they have better sense than to do that all in one go. Still, have to pay attention leading up to 11/17/20..
Oddly their agreement with Morgan Stanley on the buy out of the NSR starts on Nov 18th.... equaling $1.26 mil every six months....
Plus another agreement equal to 27.5% on the dif between London spot and $1,340 (AUD) on the first 2500 Troy oz, produced per quarter until 2035....Just a rough estimate using today's price was $412,000 for this quarter. If I understood all that Banker speak.... This could turn into a tidy sum each qtr for the scheisters with AU making a run..
All in all, with the big name interest and presumption of continued success, I'm looking forward to the coming week and a possible entry.
geodan
5 years ago
Eric Sprott audio on KRRGF. The stock is doing well again today, good to see that from Sprott but he can say more and think will. What like the most is "So, theirs your 100,000 ounces producer that might be worth a billion US which is trading, I don't know what the market cap is, I think 400 million canadien something like that and lots of exploration upside." It is in USD Market Cap (last close)$305.71M so he is implying a 3.3 bagger from here in the rear view mirror just the old run rate. Tend to agree with his take on what normal market cap should be based on past, BUT that does not have FDV, Spargos, ore sorter, etc. etc. baked in as that is coming up.
Again notice a higher % on USA side than normal. Tonite will see what happens to shorting at IB. It has held steady since Tuesday at a very high level, BUT that is 3 day delayed, So tonite will show is it dropped greatly on run-up and apparent short squeeze on Tuesday. If still the same high short position tonite then will have to scratch my head.
The chart just looks fantastic , 4 big green candles with heavy volume and another 52 week high. Clearly the big breakout we have been waiting for.
Cheers
Sprott audio this week
geodan
5 years ago
New CRUX writeup on KRRGF https://cruxinvestor.com/opinions/karora-resources-inc-tsx-krr-turnaround-story-gets-a-new-identity-more/
Karora Resources Inc. (TSX: KRR) – Turnaround Story gets a New Identity & More by Charlie Hancox, Crux Contributer @CRUXinvestor Jul. 10th '20.
cruxinvestor.com/...
« It’s hard to believe this is the same company that we looked at 1 year ago. When Paul Huet became the CEO on July 18th 2020, the company was in disarray. The Royal Nickel Company was a conundrum. Was it a nickel company? Was it a gold company? Given it didn’t it have any money, why was it spending $50M on a mill?
In just over a year, RNC Minerals has changed from an unfocussed, floundering nickel developer to a +100,000oz gold producer with significant exploration upside potential and a revamped balance sheet that didn’t even look possible. It’s churning off cash, it owns a mill, and it has c. C$40M in the bank with an AISC reducing quarter over quarter and an improved operational management team on the ground. From playing hardball with Maverix Metals over the Beta Hunt royalty, to acquiring Spargos Reward, to renegotiating and then eliminating Morgan Stanley’s NSR royalty on HGO operations, to a sensible 11:1 rollback, to bringing a focus on gold to the company by ramping up production and exploration, to a new ore sorter to increase grade through the mill, to a funded exploration programme…. Huet has done a truly exemplary job, and the much-publicised coarse gold hasn’t even been factored in yet.
With so much profit added to the company’s bottom line, there has only been one thing missing; however, it’s the most important thing of all: share price growth. Karora Resources has managed to continue hitting targets, even with national Australian bushfires and COVID-19 creating major disruption. I like management that does exactly what they say they will do. It inspires a feeling of confidence and trust. After a year of delivering on promises, I trust Huet to pilot the company into a period of growth.
As of June 17th 2020, RNC Minerals officially began trading under the banner of Karora Resources (TSX: KRR). It certainly needed to change, as institutional and gold funds still viewed RNC Minerals as Royal Nickel Company, regardless of Huet’s transparent dialogue with the market. The new name had originally divided opinion, with many investors wondering if ‘Karora Gold Resources’ may have given a more specific signal to the market of the company’s new focus. However, I was a fan from the get-go. While the 28%-owned Dumont nickel resource is no longer a core asset, it’s an exceptional nickel resource that provides good optionality for Karora Resources when the wave of EV demand begins to surge and battery metal prices rise. That said, I’d like to see RNC cash in Dumont sooner rather than later and use the capital to focus on developing the gold in Australia. In this bull gold environment, I’d take money in hand now rather than optionality in the future. The new name does well to distance the company from its confused legacy, while not entirely eradicating the company’s multifaceted, multi-commodity nature.
What does this name change really mean for the company though? What is this signal? If investors read between the lines, they will likely realise that it marks the end of an era: Karora Resources’ turnaround phase is over. This is positive for shareholders for a variety of reasons. Firstly, it demonstrates Huet’s confidence that the company has finally distanced itself from the problems of yesteryear. In addition, the new brand has been well-received by the market: trading volumes are up and a new raft of institutional shareholders is steadying the erratic, sentiment-driven short-selling. Lastly, it shows that Karora Resources’ focus is no longer solely on rectification and stabilising. Instead, the focus is on growth; that can only be good news for long-term shareholders who have seen little reward for years of patience. This is a new era: an era of growth. It’s time to see some accretive value after years in the doldrums.
What catalyst moments can investors look towards with anticipation in 2020? The high-grade, open-pit Spargos Reward will be fast-tracked into the production pipeline, adding meaningful higher-grade ounces to the company’s mill. It’s just 45Km from Karora Resources’ plant. Moreover, the recently announced Maverix Metals royalty renegotiation on Beta Hunt frees up the company to get back to mining at Beta Hunt again. It has been well received by the market as the company had already paid over A$30M in royalties since it acquired Beta Hunt. Spargos Reward has over 130,000oz gold in the resource at an average of 3g/t in an open pit. These are exciting times if Huet can deliver.
Furthermore, the company is well on track to exceed its guidance for 2020: no mean feat under what has been a difficult start to the year with the Australian bush fires, then torrential rains and COVID-19. I expect that with cash in the bank, investors can expect to see significant exploration this year, combined with more potential M&A. And did I mention the ore sorter? That should remove 20-30% or the ore, thus increasing the grade throughput at the mill. More margin. More cash. Feels good to be in gold doesn’t it. »


 Renee
7 months ago
Renee
7 months ago

 Hot Features

