Hot Features

Cryptocurrency markets have enjoyed an excellent start to the year, and from the December low, the market value of the 5075 cryptocurrencies tracked by Coinmarketcap has risen from 166 billion dollars to 250 billion. Bitcoin, BTCUSD, makes up about 65% of the total market capitalization and has gained by 44% from its December lows, but other and smaller coins have risen even more. As an example, the fifth-biggest coin per market cap, Bitcoin SV, was up by 270% from its December low, but on January 14, the coin was up by 498%.
With Bitcoin prices in a clear uptrend, investors have dared to venture into smaller coins, and one that has attracted my attention is Litecoin. It has a market cap of almost 4 billion USD which is significantly lower than Bitcoin’s 169.billion. However, it is still one of the ten biggest coins.
Trying to understand the demand for Litecoin (LTCUSD), based on fundamentals as we can do with stocks or other assets if a tricky business, using technical analysis is better.
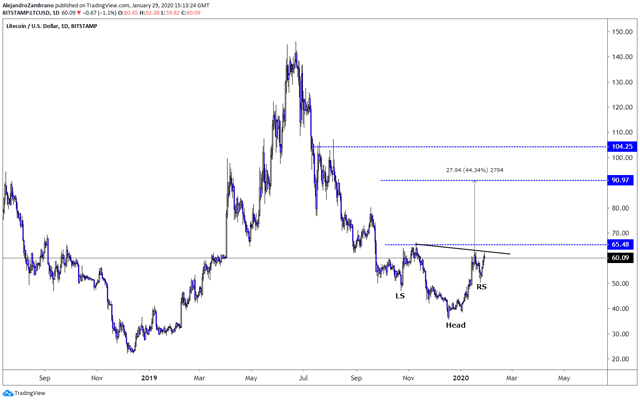
Since September 2019, the price of LTCUSD has created an inverse head and shoulders pattern, and the price is near to trigger a breakout. The key level I am watching is the November 9 high of $65.48. Some would argue, that a break to the 2020 high of $63.53 would be enough to trigger the pattern, but I have found that including a horizontal resistance level like the November 9 high, strengthens the case that the breakout is genuine.
If the price indeed trades above the November 9 high, then LTCUSD might be able to reach the inverse head and shoulders pattern target at $90.97, as long as the price does not trade firmly back below the current 2020 high of $63.53. The next level beyond the H&S pattern target is the July 2019 high of $104.82, and it would not be surprising if traders targeted this level, as they prone to heard and may opt to buy more the stronger the trend.
Written by Alejandro Zambrano, Chief Market Strategist at ATFX UK.
Check out Alejandro’s author profile on InvestingCube for more analysis.
LTCUSD Daily Chart