Hot Features

Gold prices have had a terrific week, and from the weekly low, the price was at one point up by 70.46 dollars per contract.
Since the summer of 2019, I have been bullish, and I said back then that the price could reach $1700 following the triggering of a large inverse head and shoulders pattern. I still think there is a good possibility that the price will reach $1700, but I believe that the price is short-term overbought.
Are gold prices short-term overbought?
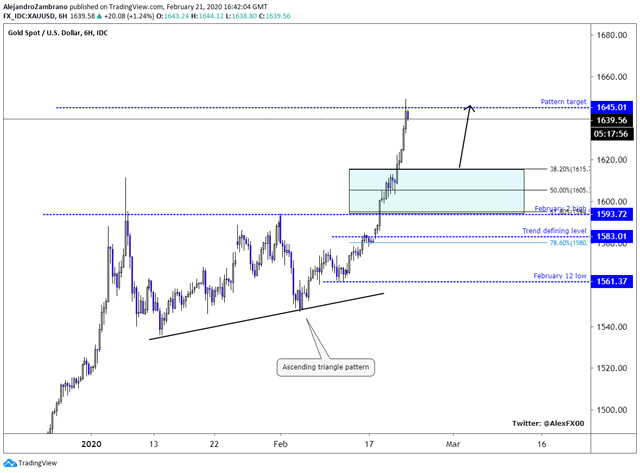
Last week and early this week I said that the price could reach $1645 on a break to the February 2 high of $1593.73. The rationale behind my bullish view was I saw the consolidation between January 8 to February 18 as an ascending triangle, with a target of $1645. The price has now reached this level, and we could see some profit-taking.
The overbought conditions and distance from the last significant low, the February 4 low at $1547, might not stop the price to add to its gains, but it does provide a poor risk-reward ratio for fresh long positions. Instead, I think traders that missed the initial bull leg, or that want to take part in the next upward move will wait for a corrective move.
The next bull leg
Drawing Fibonacci levels based on the February 4 low of $1547 to the current 2020-high of $1649.40, suggests that the interval between the 38.2% and 61.8% correction levels could be the spot for the emergence of the next bullish leg. The Fibonacci levels just mentioned are $1595 and $1645.
The price could retrace more than 61.8% of the latest upward move, but that would be worrying for the bulls, and if the price trades below the breakout candle low at $1583, I suspect that traders will be less interested to buy gold, and we could see a steeper correction. I am, therefore, having the $1583 level as my trend defining level for gold prices.
I think the price could revisit the 2020-high of $1649.40, followed by the inverse head and shoulders pattern target at $1700 if the price indeed turns higher from the interval mentioned above.
Written by Alejandro Zambrano, Chief Market Strategist at ATFX UK.
Gold Price Chart