Hot Features

Before the DAX index bottomed out on March 19, and then rose by 35%, I have been arguing that the key to understanding stock market movements was to keep an eye on the new coronavirus infections. The DAX index did indeed bottom out when the coronavirus cases were growing at their fastest rate, and just before the US and Germany locked down.

On the way up from the March 19 low, the number of infections has slowed markedly. In Germany, from 73% on March 19 to the latest reading of 1.6% on April 23. In the US, the growth rate dropped from 51% on March 19 to the April 23 rate of 3.7%.
With the virus growth being under control, it might soon be possible for governments to ease lockdowns, and this could see an immediate jump in the economics readings for June, possibly even May, depending on when the Europe area economies open.
The next critical item that traders will be focusing on will be the state of the Euro area economy in June. If the Euro area economy follows the path of the Chinese economy, then we will see higher economic activity. However, I think this scenario is already priced into the DAX 30. Because, if investors were not anticipating better times ahead, the DAX would still be trading around its March low, or possibly even lower.
In the longer run, I think the DAX index will claw back its 2020 losses, as a vaccine or cure should be around the corner. But in the short-term, the price might even revisit its March low.
The key for the market to revisit its March low is for the economy not to rebound, and for a second wave of the virus to form. However, if we look at China, then their economy is doing better than during the lockdown, and there is no second wave of cases. This makes me think that the DAX might be able to trade higher, in the weeks ahead, but I am not as bullish as I was when the DAX was at its March low.
DAX 30 Technical Outlook
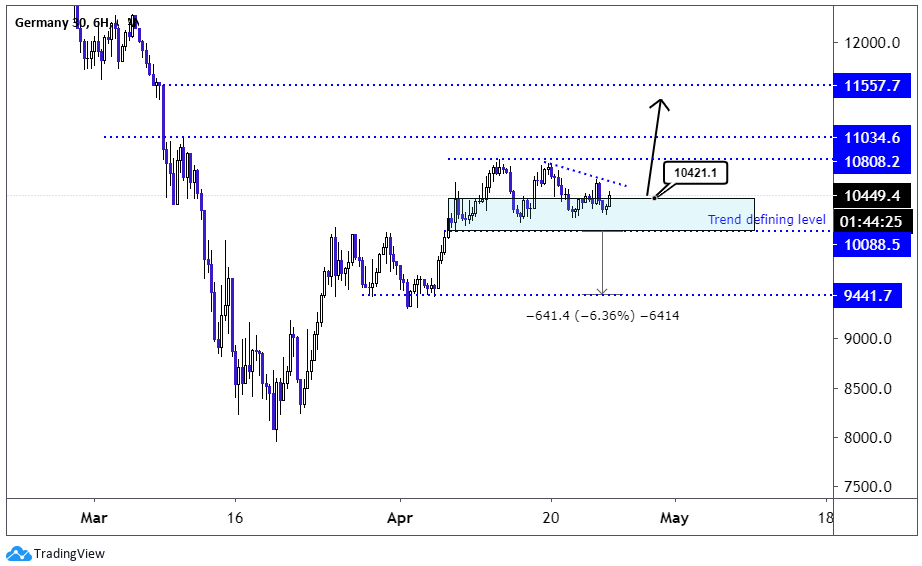
From a technical point of view, the DAX 30 trend will remain upwards as long as the price trades above the April 7 low of 10088, and I suspect traders will be buying the index in the 10088 to 10421 interval. The next resistance level, and likewise the target of traders is the April 19 high of 10750, followed by the March 10 high of 11034, and the March 8 high of 11557.
The alternative scenario is a break to the April 7 low of 10088. As we can see in the chart below the index has been trading sideways for some time and created a descending triangle pattern, so if the price trades below the April 7 low, the DAX 30 might reach the 9441 level.
DAX 30 Chart
Written by Alejandro Zambrano, Chief Market Strategist at ATFX UK.
Check out Alejandro’s author profile on InvestingCube for more analysis.