Hot Features

Key Support Levels: $3, $2, $1

Key Resistance Levels: $5, $6, $7
ATOM/USD Price Long-term Trend: Bullish
Cosmos is now in a bull market. Currently, the coin is trading below the $4.50 resistance. In retrospect, the bear market was terminated at a low of $2 and the coin rebounded. The upward move was resisted at a $3.40 price level. The coin fell and retested the previous low at $2.
Cosmos is now in a bullish move as it broke the previous resistance at $3.40. The upward move was finally halted at the $4.50 resistance on November 11. Cosmos slumped to the low of $3 and resumed another bullish move to retest the overhead resistance. Presently the coin is facing price rejection at the overhead resistance.
Daily Chart Indicators Reading:
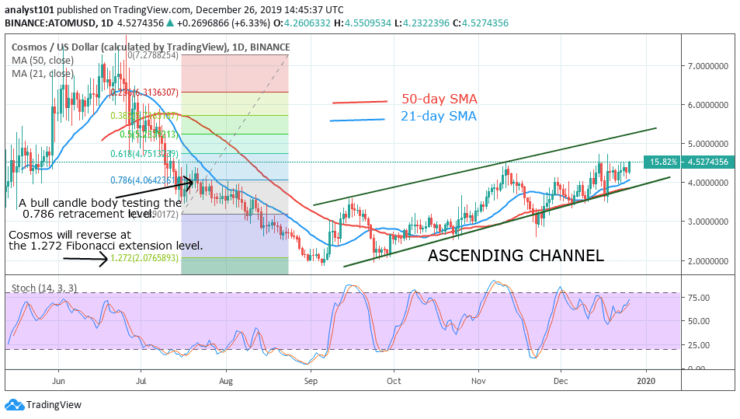
The stochastic indicator is above the 50% range which indicates that the Cosmos is in a bullish momentum. The market is actually rising but the bulls are finding it difficult to penetrate the overhead resistance.
The simple moving averages are pointing northward indicating that the coin is rising. From the Fibonacci tool, it indicates that Cosmos is likely to reverse at the 1.272 extension level. Earlier a bullish candlestick body tested the 0.786 retracement level which gave a clue of the trend reversal.
ATOM/USD Medium-term bias: Bullish
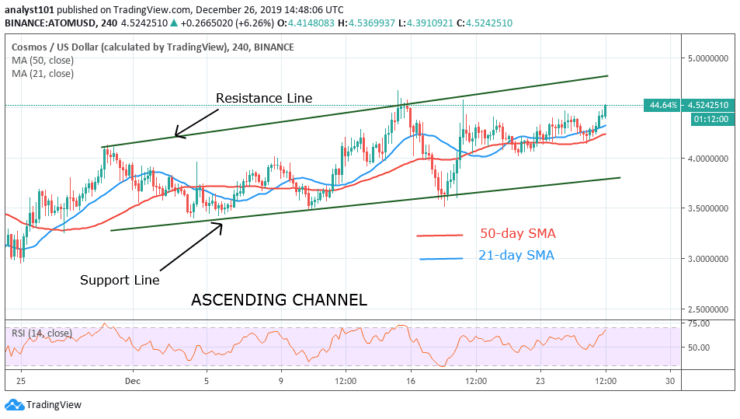
On the 4-hour chart, the coin is also in a bullish move. The coin was facing resistance at $4 but after a retest, the resistance was broken. However, the bulls went up again but could not penetrate the overhead resistance. The market is in a sideways move below the $4.50 overhead resistance.
4-hour Chart Indicators Reading
The Relative Strength Index period 14 level 61 is above the centerline 50. This indicates the coin is in a bullish trend zone. The market is said to be in an uptrend. However, a bullish break at $4.50 resistance will catapult the coin to a high of $7.0.
General Outlook for Cosmos (ATOM)
Cosmos is in a bull market but yet to break the overhead resistance. Each time the bulls test the overhead resistance, the coin will fall or retrace to the next support. The coin is lacking buyers at the upper price levels. Possibly a bullish break at the overhead resistance will push the coin to higher price levels. Nevertheless, if the bulls fail to break the overhead resistance, the bears will take undue advantage to sink the coin below the support line. This will plunge the coin to its previous low.
Cosmos Trade Signal
Instrument: ATOM/USD
Order: Buy Limit
Entry price: $4
Stop: $3
Target: $7
Source: https://learn2.trade