Hot Features

Key Support Levels: $0.06, $0.05,$0.04

Key Resistance Levels: $0.09, $0.10, $0.11
XLM/USD Long-term Trend: Ranging
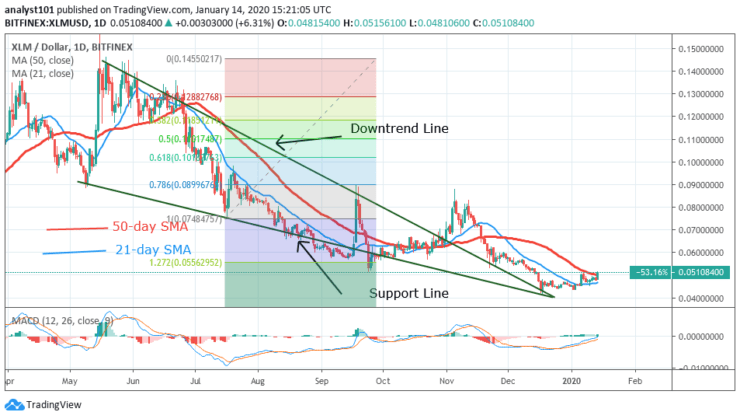
Today, Stellar is making a positive move to come out of the oversold region. On December 17, the coin fell to the low $0.042 but has risen to a high of $0.050. The price movement had been rather slow because of indecision candlesticks. The market has been characterized by small body candlesticks like spinning tops and Doji candlesticks which have been responsible for the consolidation.
Daily Chart Indicators Reading:
In its upward move, the bulls have broken above the 21-day SMA. XLM is likely to rise if the bulls break above 50-day SMA. The coin will rise if the price bars are above the SMAs. The MACD line and the signal line are below the zero line which indicates a sell signal.
.
XLM/USD Medium-term bias: Bullish
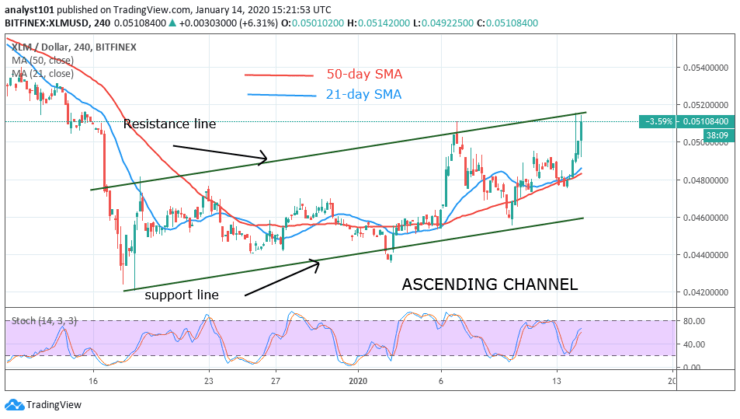
On the 4 hour chart, Stellar bounces at the bottom of the chart. The coin is making a series of higher highs and higher lows. Stellar is facing resistance at $0.050 price level. A break above $0.050 will catapult the coin to a high of $0.052.
4-hour Chart Indicators Reading
Stellar is in a bullish momentum as it trades above 40% range of the daily stochastic. The bullish momentum is fluctuating. On the ascending channel, if price breaks above the resistance line and closes, the stellar will be in an upward move. Conversely, a break below the support will attract selling pressure.
General Outlook for Stellar
Stellar is still in a bear market. To come out of the downtrend zone, the bulls have to break the resistance at $0.060. Meanwhile, the Fibonacci tool indicates that XLM ought to have reversed at the 1.272 extension level. Nonetheless, the selling pressure of Stellar has been overdone. Buyers ought to emerge as the coin is oversold.
Stellar Trade Signal
Instrument: XLM/USD
Order: Buy
Entry price: $0.050
Stop: $0.042
Target: $0.06
Source: https://learn2.trade