ADVFN Logo

We could not find any results for:
Make sure your spelling is correct or try broadening your search.

Trending Now

Toplists

It looks like you aren't logged in.
Click the button below to log in and view your recent history.

Hot Features

Registration Strip Icon for alerts Register for real-time alerts, custom portfolio, and market movers

Bitcoin (BTC) Stable Above $7,500, Sellers May Likely Emerge

Share On Facebook
share on Linkedin
Print

Key Support Zones: $7, 000, $6, 000, $5,000

©
Key Resistance Zones: $10,000, $11,000, $12,000

BTC/USD Long-term Trend: Bullish
Bitcoin is still consolidating above $7,500 since March 23. The price action is characterized by small body indecisive candlesticks. The candlestick indicates that buyers and sellers are undecided about the next move of the coin. On the upside, if the market decides to go up above $8,000; the momentum will extend to $9,000.

The $8,000 resistance is regarded as the major resistance to be crossed. Bitcoin will have move avenues for price rallies. Conversely, if BTC faces rejection, its initial drop will be to a low of $7,200. Subsequently, the downward move will extend to either $6,800 or $6,600 low.


BTC/USD – Daily Chart

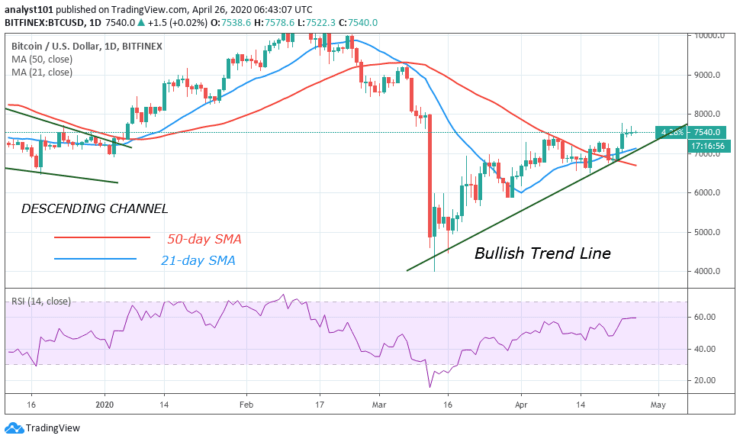
Daily Chart Indicators Reading:
Bitcoin’s recent upward move rises to level 59 of the Relative strength index indicating that the coin is in an uptrend zone. The RSI is currently flat as the sideways trend continues. It is also above the centerline 50. The moving averages have indicated a bullish crossover.

BTC/USD Medium-term Trend: Bullish
On the 4– hour chart, the price spike reached the trend line and pulled back above $7,500. The market is fluctuating above 21-day SMA and 50-day SMA. At the end of consolidation, price may break below SMAs or the SMAs may hold. BTC may fall, if it breaks below the SMAs. However, the uptrend will resume, if the SMAs hold.


BTC/USD – 4 Hour Chart

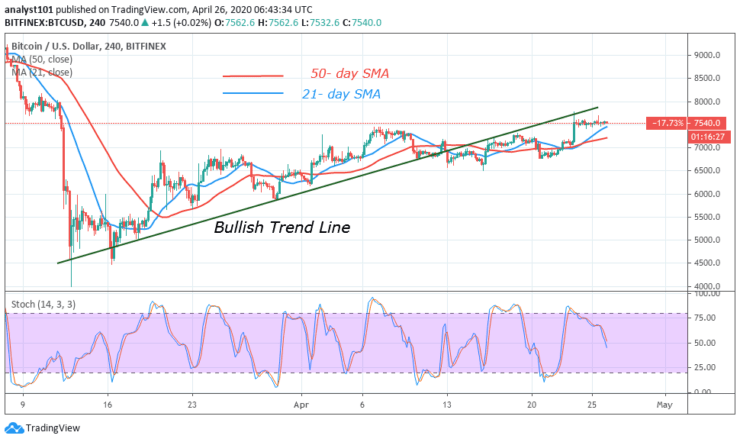
4-hour Chart Indicators Reading
The market reached the overbought region after the price spike. BTC is below 80% range of the daily stochastic. This is in contradiction to the price action as the market is still consolidating. The SMAs are sloping upward.

General Outlook for Bitcoin (BTC)
Bitcoin is still above $7,500, sustained by small body candlesticks describing the indecision of buyers and sellers about the direction of Bitcoin. However, there is a bearish signal of its impending fall.


Source: https://learn2.trade

CLICK HERE TO REGISTER FOR FREE ON ADVFN, the world's leading stocks and shares information website, provides the private investor with all the latest high-tech trading tools and includes live price data streaming, stock quotes and the option to access 'Level 2' data on all of the world's key exchanges (LSE, NYSE, NASDAQ, Euronext etc).

This area of the ADVFN.com site is for independent financial commentary. These blogs are provided by independent authors via a common carrier platform and do not represent the opinions of ADVFN Plc. ADVFN Plc does not monitor, approve, endorse or exert editorial control over these articles and does not therefore accept responsibility for or make any warranties in connection with or recommend that you or any third party rely on such information. The information available at ADVFN.com is for your general information and use and is not intended to address your particular requirements. In particular, the information does not constitute any form of advice or recommendation by ADVFN.COM and is not intended to be relied upon by users in making (or refraining from making) any investment decisions. Authors may or may not have positions in stocks that they are discussing but it should be considered very likely that their opinions are aligned with their trading and that they hold positions in companies, forex, commodities and other instruments they discuss.

Leave A Reply

 
Do you want to write for our Newspaper? Get in touch: newspaper@advfn.com