Key Resistance Zones: $10,000, $11,000, $12,000
Key Support Zones: $7, 000, $6, 000, $5,000

BTC/USD Long-term Trend: Bullish
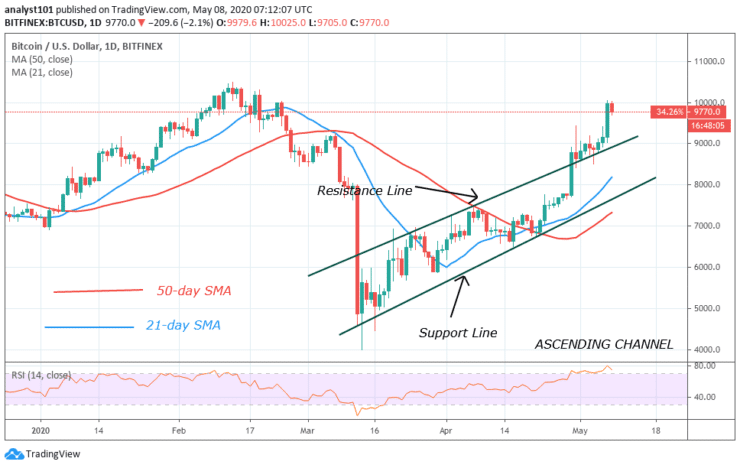
Bitcoin has finally broken the $9,200 and $9,400 resistances as the market approaches the $10,000 resistance. Yesterday, price was hovering between $9,000 and $9,300 before penetrating the resistance zone. From the daily chart, Bitcoin has reclaimed the $9,500 price level in February. The bulls are likely to push above the $10,000 resistance but are currently facing resistance.

Daily Chart Indicators Reading:
Bitcoin is at level 78 of the daily Relative strength index. This indicates that the market is in the overbought region where sellers are likely to emerge. In some trending markets, the oversold or overbought conditions may not hold. The 21-day SMA and the 50-day SMA are sloping upward.
BTC/USD Medium-term Trend: Bullish
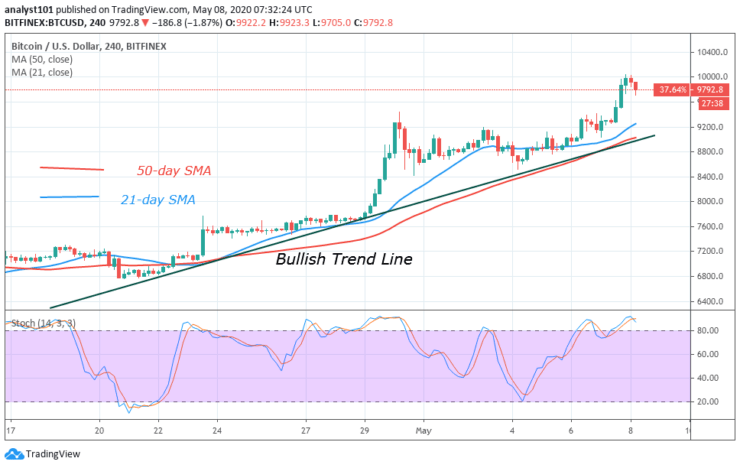
On the 4– hour chart, Bitcoin is in an uptrend. The price action indicates that on April 30, the bulls fail to break the $9,200 resistance. Yesterday, the $9,200 and $9,400 were broken as the market approaches $10,000 resistance. Presently, the bulls are being resisted at the $10,000 resistance. The crypto is retracing and may reach a low of $9,500.

4-hour Chart Indicators Reading
BTC is currently above 80% range of the daily stochastic. The price is in the overbought region. The SMAs are sloping upward as Bitcoin continues its rise. Sellers are likely to emerge in the overbought region.
General Outlook for Bitcoin (BTC)
Bitcoin has reached the $10,000 price level. The coin is gaining more bullish momentum as it is expected to hit the $10,500. However, at the moment, the bulls are facing resistance as BTC retraces. The uptrend will resume immediately after the retracement.
Source: https://learn2.trade

 Hot Features


