Key Support Levels: $200, $160, $120

Key Resistance Levels: $275, $300, $350
BCH/USD Price Long-term Trend: Bullish
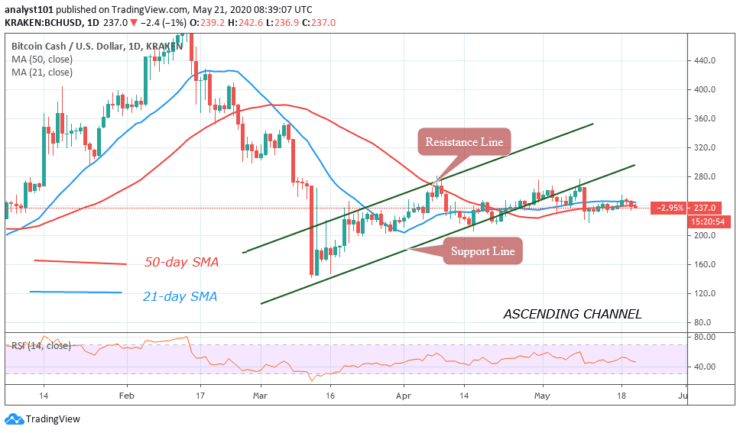
Today, Bitcoin Cash is consolidating above $230 but characterized by small body candlesticks. On May 8, the bulls attempted to retest the $280 resistance but were resisted. BCH dropped to $230 low and resumed consolidation. Further upward move has been resisted below $250 high. BCH will fall to $200 low if the bulls fail to break the resistance at $250.

Daily Chart Indicators Reading:
The 21-day SMA and 50-day SMA are sloping horizontally indicating the price consolidation. BCH is at level 47 of the daily Relative Strength Index. BCH is in a downtrend zone and may likely fall.
BCH/USD Medium-term Trend: Ranging
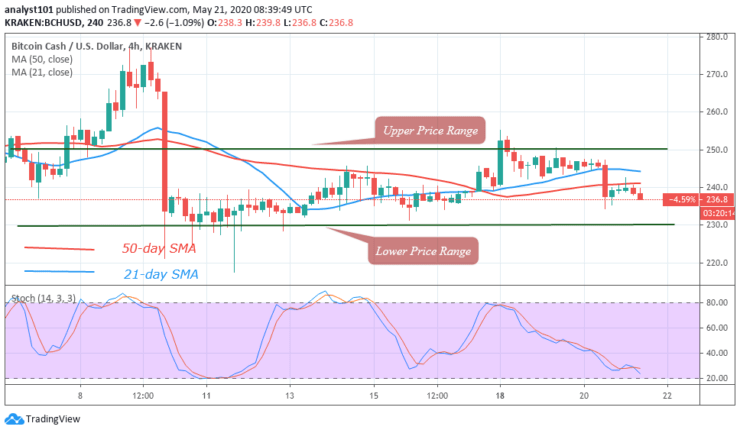
On the 4-Hour chart, BCH is in a sideways move. The crypto has been in a range bound movement between $230 and $250 since May 10. The bulls find penetration difficult at the $250 resistance level. There is likelihood of continuous price fluctuation until the levels are broken.

4-hour Chart Indicators Reading
Bitcoin Cash is above 20% range of the daily stochastic. The stochastic bands are pointing downward and approaching the oversold region. BCH will resume upward move, if the lower price range holds. The coin will further depreciate if the lower price range is broken.
General Outlook for Bitcoin Cash (BCH)
The crypto is in a period of consolidation. The uptrend will resume if price breaks above the $250 resistance. The market will remain in consolidation if the levels remained on unbroken.
Source: https://learn2.trade

 Hot Features


