ADVFN Logo

We could not find any results for:
Make sure your spelling is correct or try broadening your search.

Trending Now

Toplists

It looks like you aren't logged in.
Click the button below to log in and view your recent history.

Registration Strip Icon for default Register for Free to get streaming real-time quotes, interactive charts, live options flow, and more.

USD/JPY Consolidates Below Level 108, Breakout Likely

Share On Facebook
share on Linkedin
Print

Key Resistance Levels: 111.000, 112.000, 113.000
Key Support Levels: 104.000, 103.000, 102.000

©

USD/JPY Price Long-term Trend: Ranging
The pair is currently in a sideways move between the levels of 110 and 108. The Yen was in an uptrend but it is facing resistance at level 108. The pair is on a downward move as a result of the resistance at level 108. The Yen may reach a low of level 106 if the selling pressure continues.


USD/JPY – Daily Chart

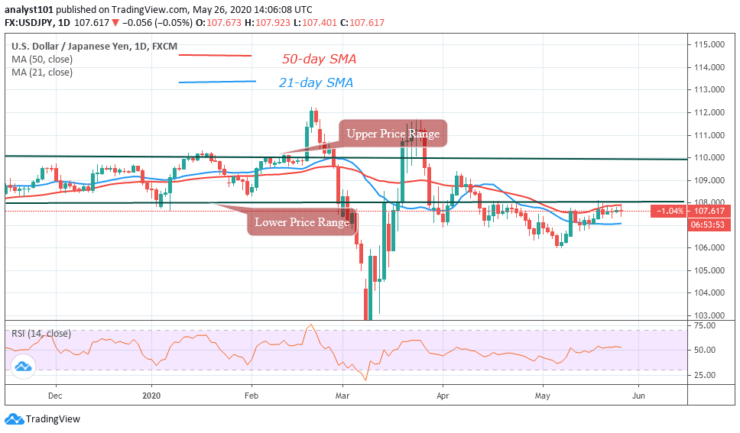
Daily Chart Indicators Reading:
The 21-day SMA and 50-day SMA are sloping horizontally indicating the sideways move. The Yen is currently at level 51 of the daily Relative Strength Index. The Japanese Yen is still in the uptrend zone and above the centerline 50. The market is currently falling after resistance.

USD/JPY Medium-term Trend: Bullish
The USD/JPY pair is trading in a bear market. Recently, the Yen moved up but was resisted twice at level 108. On May 14, A bullish candle body tested the 0.382 Fibonacci Retracement level. As the bullish candlestick tested the 0.382 retracements, the Yen will fall and reverse at 1.618 extension level. This is equivalent to level 106.


USD/JPY – 4 Hour Chart

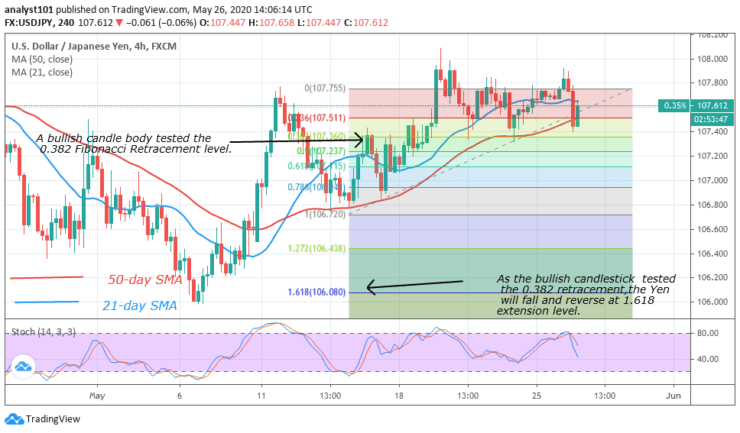
4-hour Chart Indicators Reading
The pair is below 80% range of the daily stochastic. This implies that the market is in a bearish market. This is a confirmation to the price action which is indicating bearish signals. The SMAs are also sloping upward indicating the upward move.

General Outlook for USD/JPY
The Japanese Yen is currently in a downward  move after falling from level 108. The market will fall to level 106.800 but if the selling pressure persists, the pair will reach the low of 106. Alternatively, the price will consolidates below level 108 for a breakout.


Source: https://learn2.trade

CLICK HERE TO REGISTER FOR FREE ON ADVFN, the world's leading stocks and shares information website, provides the private investor with all the latest high-tech trading tools and includes live price data streaming, stock quotes and the option to access 'Level 2' data on all of the world's key exchanges (LSE, NYSE, NASDAQ, Euronext etc).

This area of the ADVFN.com site is for independent financial commentary. These blogs are provided by independent authors via a common carrier platform and do not represent the opinions of ADVFN Plc. ADVFN Plc does not monitor, approve, endorse or exert editorial control over these articles and does not therefore accept responsibility for or make any warranties in connection with or recommend that you or any third party rely on such information. The information available at ADVFN.com is for your general information and use and is not intended to address your particular requirements. In particular, the information does not constitute any form of advice or recommendation by ADVFN.COM and is not intended to be relied upon by users in making (or refraining from making) any investment decisions. Authors may or may not have positions in stocks that they are discussing but it should be considered very likely that their opinions are aligned with their trading and that they hold positions in companies, forex, commodities and other instruments they discuss.

Leave A Reply

 
Do you want to write for our Newspaper? Get in touch: newspaper@advfn.com

By accessing the services available at ADVFN you are agreeing to be bound by ADVFN's Terms & Conditions

Support: 1-888-992-3836 | help@advfn.com