LINK price making a series of lower highs and lower lows
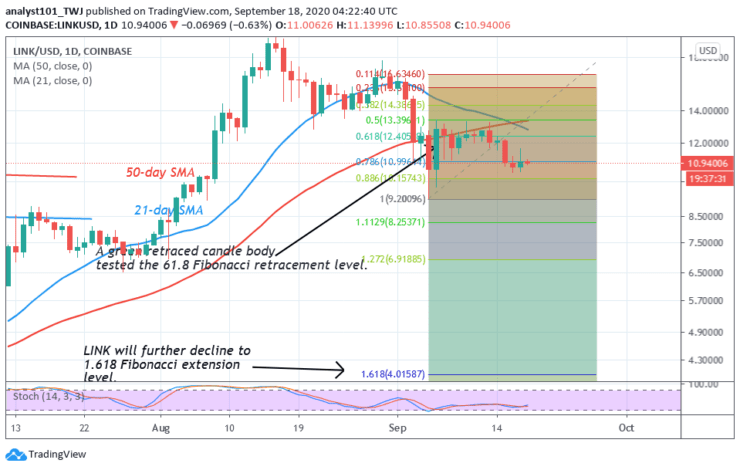
The market may fall to $4 low if the support at $9.50 is breached
Chainlink (LINK) Current Statistics
The current price: $11.01
Market Capitalization: $3,853,295,393
Trading Volume: $1,244,310,906
Major supply zones: $18.00, $20.00,$22.00
Major demand zones: $8.00, $6.00, $4.00

Chainlink (LINK) Price Analysis September 18, 2020
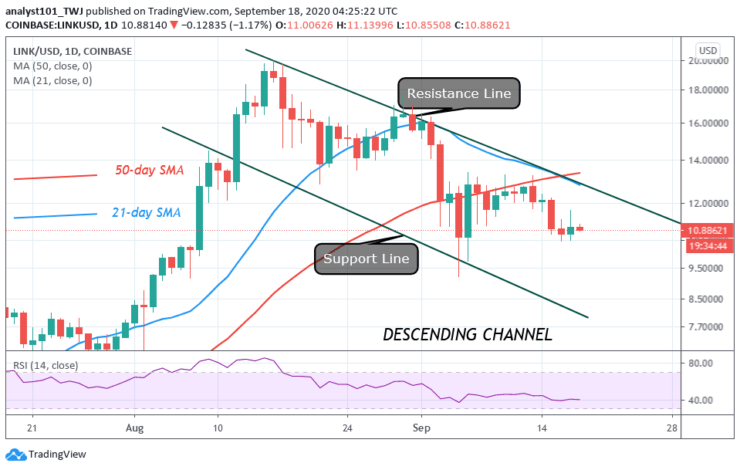
Since August 15, LINK price has been making a series of lower highs and lower lows. This explains that the coin is in a downtrend. It will continue to fall except the bearish pattern is interrupted. Today, LINK is trading at $11 at the time of writing.
On the upside, if buyers push LINK above the $14 high, the coin will resume upside momentum. However, if buyers fail to sustain the upward move, the downtrend will continue. On the downside, the market is falling to the lower lows.

Chainlink Technical Indicators Reading
LINK is now in a descending channel. The coin will resume uptrend if price breaks and closes above the resistance line of the descending channel. In the same vein, the crypto will further decline, if price breaks below the support line of the descending channel. Meanwhile, the price action is indicating a bearish signal.

Conclusion
On September 5, the coin has earlier fallen to the $9.50 low before making an upward correction. On September 5 downtrend, the retraced green candle body tested the 61.8 % Fibonacci retracement level. This implies that the market will fall to the 1.618 Fibonacci retracement level. That is a low of $4.
Source: https://learn2.trade

 Hot Features


