Key Levels
Resistance Levels: 1.4345, 1.4000, 1.3624
Support Levels: 1.3134, 1.2675, 1.1958
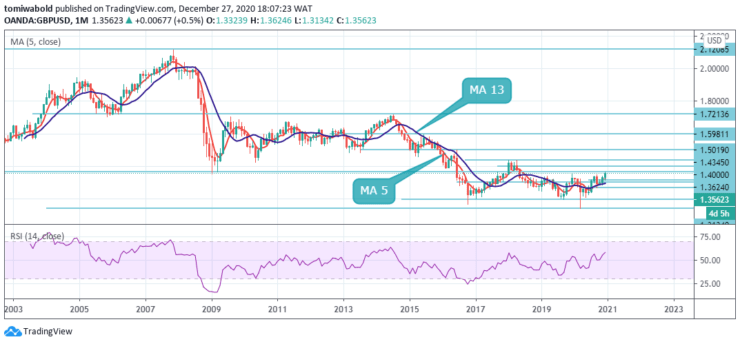
 GBPUSD Monthly Chart: Ranging
GBPUSD rallied from March lows at 1.1409 to prove its resilience. Monthly technical data favors further recovery as price bounced off its moving average of 5 while the RSI consolidates towards 60.

GBPUSD hit an all-time low of 1.1409 in early March 2020 in response to the coronavirus crisis. Although the pair hit a 35-year low, the pair rebounded and continued to rally amid Brexit hopes, reaching a new 2020 high of 1.3554. The risk remains heightened as long as there is hope for Brexit.
Moving average 13 acts as a reliable support in the event of a decline, both below the current level, and in the event of a bullish expansion. The risk remains biased upward as long as the price remains above 1.3000. Confirmation of the fall in GBPUSD will be a breakdown of the support area and the closing price below 1.3000.
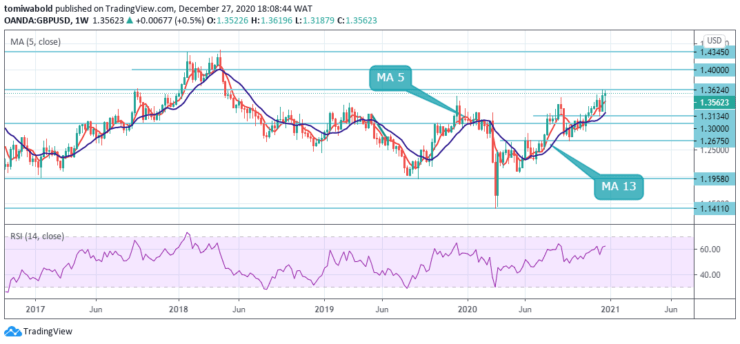
 GBPUSD Weekly Chart: Ranging
GBPUSD rose from 1.2675 last week to hit 1.3624. But since a temporary top has formed there, the initial bias is neutral initially this week. On the other hand, a break of 1.3624 will target the 61.8% forecast of 1.1409 to 1.3482 from 1.2675 to 1.4345 next. In such a scenario, the short-term trend remains bullish as long as support at 1.3134 is held, in case of a deeper pullback.
A decisive breakout should also occur on sustained trading above the 5 and 13 moving averages. This should confirm the mid-term bottom at 1.1409. The trend can then be reversed to bullish up to the resistance level of 1.4345 and above. However, the 1.3514 deviations could keep the medium-term bearish sentiment for another decline below 1.1409 in the next phase.
Conclusion
GBPUSD may end the trading week outside the 1.3624 zones. The pair continues to move within the framework of growth and the formation of an upward recovery pattern. Moving averages indicate a bullish trend. t the moment, we should expect an attempt to grow and test the resistance area near the level of 1.4000.
Source: https://learn2.trade

 Hot Features


