ADVFN Logo ADVFN

We could not find any results for:
Make sure your spelling is correct or try broadening your search.

Trending Now

Toplists

It looks like you aren't logged in.
Click the button below to log in and view your recent history.

Hot Features

Registration Strip Icon for alerts Register for real-time alerts, custom portfolio, and market movers

Binance Coin (BNBUSD) Price Breaks $254 Price Level Downside, Further Price Decrease Is Possible

Share On Facebook
share on Linkedin
Print

Further price decrease envisage provided the bears increase their pressure and the support level of $196 is penetrated, then, the support level at $142 and $117 may be tested. The breaking up of the $254 price level will expose the coin to $311 and $364 price level.

©
BNBUSD Price Analysis – March 26
BNB/USD Market
Key levels:

Supply levels: $254, $311, $364

Demand levels: $196, $142, $117

BNBUSD Long-term Trend: Bearish

On the daily chart, BNBUSD is bearish. The bulls could not continue to hold onto the BNB market when they push the coin to the resistance level at $311. The bears defended the level with the formation of daily bearish candle, following the scenario is the declination of the price towards the support level at $196 price level after it has broken down the former support level of $254.

BNBUSD daily chart, March 26

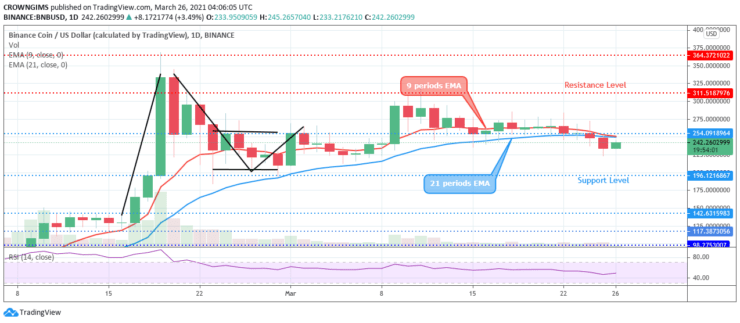
The coin has crossed the two EMAs downside and it is trading below the 9 periods EMA and the 21 periods EMA while the former is trying to cross the later. This is a sign of increasing bearish momentum. Further price decrease envisage provided the bears increase their pressure and the support level of $196 is penetrated, then, the support level at $142 and $117 may be tested. The breaking up of the $254 price level will expose the coin to $311 and $364 price level. However, the relative strength index period 14 with its signal line is below 50 level pointing up as a sign of buy signal which may be a pullback.

 BNBUSD medium-term Trend: Bearish

BNBUSD is bearish in the 4-hour chart. Last week, the crypto was on ranging movement within $311 and $254 price level. On March 24, the bears push the coin to penetrate the support level at $254 downside and the price is targeting $196 price level.

BNBUSD 4-hour chart, March 26

The price is trading below the 9 periods EMA and 21 periods EMA. The Relative Strength Index period 14 is pointing down at 40 levels indicate a sell signal.


Source: https://learn2.trade

CLICK HERE TO REGISTER FOR FREE ON ADVFN, the world's leading stocks and shares information website, provides the private investor with all the latest high-tech trading tools and includes live price data streaming, stock quotes and the option to access 'Level 2' data on all of the world's key exchanges (LSE, NYSE, NASDAQ, Euronext etc).

This area of the ADVFN.com site is for independent financial commentary. These blogs are provided by independent authors via a common carrier platform and do not represent the opinions of ADVFN Plc. ADVFN Plc does not monitor, approve, endorse or exert editorial control over these articles and does not therefore accept responsibility for or make any warranties in connection with or recommend that you or any third party rely on such information. The information available at ADVFN.com is for your general information and use and is not intended to address your particular requirements. In particular, the information does not constitute any form of advice or recommendation by ADVFN.COM and is not intended to be relied upon by users in making (or refraining from making) any investment decisions. Authors may or may not have positions in stocks that they are discussing but it should be considered very likely that their opinions are aligned with their trading and that they hold positions in companies, forex, commodities and other instruments they discuss.

Leave A Reply

 
Do you want to write for our Newspaper? Get in touch: newspaper@advfn.com