Hot Features

USDJPY price outflow is being held back as a consequence of bears causing opposition to the market influence. The price structure of the market strives to maintain an uptrend configuration under a bullish influence. However, the sellers are causing some resistance in the market, which is causing a hold in the market configuration. Because of this conflict in the market, the outflow of the bulls in the market will be held back to the 114.840 critical level.

USDJPY Critical Levels
Resistance Levels: 114.840, 112.790
Support Levels: 110.800, 109.100
 USDJPY Long Term Trend: Bullish
The bullish outflow price structure initially began with the expansive breadth of consolidation. The market was birthed after a strong price expansion before the bullish uprise. The price undulated between the breadth of the 110.800 and 109.100 significant price levels. As a result of this accumulation, the price was then pushed out to higher levels. With the continuation of the market expansion, buyers outflow upward, with the bulls taking hold of the market.
Furthermore, price continues to experience more outflows as several structural levels were broken. When USDJPY eventually gets to the 112.790 level, the price resumes its accumulation phase. The market encountered a short phase of expansion before resuming bullish persistence. The price finally breaks through the 114.840 significant level and we expect a withdrawal back to this price level before bullish engagement. The Tensile Strength indicator shows the resilience of the market influence as the market is set to resume its bullish leverage after sellers retreat.
 USDJPY Short Term Trend: Bearish
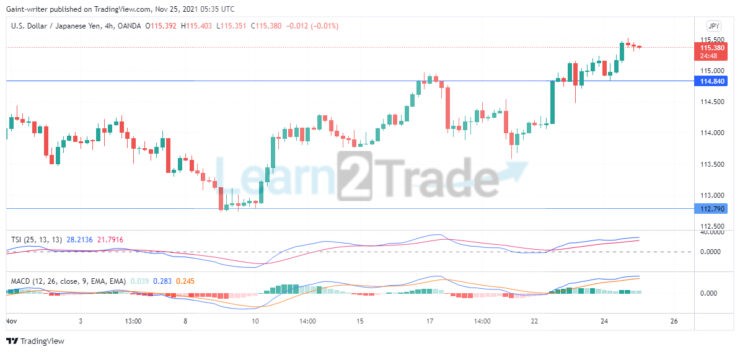
The 4-hour chart of USDJPY shows the price configuration riding upward following a strong force that broke through the 114.840 critical level. The price is now set in a retreat motion as the price is seen to be pulling away to the 114.840 price level. The Moving Average Convergence and Divergence indicator shows the market’s prevalent direction as the price is set on a pullback course to the 114.840 critical level before bullish outflow.
Source: https://learn2.trade