Hot Features

The breaking up of $0.755 level by the bulls may push the price to test the resistance level of $0.763 and $0.770. Failure to break up the $0.755 level may lead to price reversal movement towards the support level of $0.745, $0.731 and $0.717.

AUDUSD Price Analysis – March 30
AUD/USD Market
Key levels:
Resistance levels: $0.755, $0.763, $0.770
Support levels: $0.745, $0.731, $0.717
AUDUSD Long-term trend: Bullish
On the daily chart, AUDUSD is bullish. The currency pair really follow the direction of double bottom chart pattern formed Last three weeks. The currency pair formed a double bottom chart pattern at the support level of $0.968. The bullish momentum in the daily chart increased and turned the former resistance levels of $0.731 and $0.745 to support levels. The price reaches the high of $0.7555 last week and started a consolidation movement.
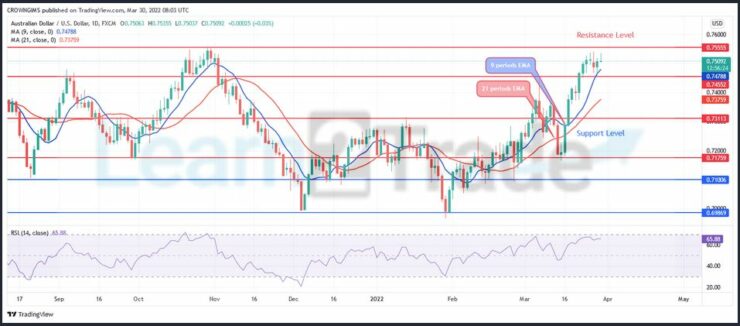
AUDUSD price is currently trading above the 9 periods EMA and 21 periods EMA which indicate that bulls’ momentum is increasing. The relative strength index period 14 is at 66 levels and the signal lines pointing up displaying bullish direction. The breaking up of $0.755 level by the bulls may push the price to test the resistance level of $0.763 and $0.770. Failure to break up the $0.755 level may lead to price reversal movement towards the support level of $0.745, $0.731 and $0.717.
AUDUSD medium-term Trend: Bullish
AUDUSD is bullish on the 4-hour chart. The sellers’ pressure was terminated at the support level of $0.717 on March 16. The bears’ pressure failed and the buyers gained more pressure to push up the price. The resistance level of $0.755 was tested last week after it penetrated $0.731 and $0.749 levels upside.
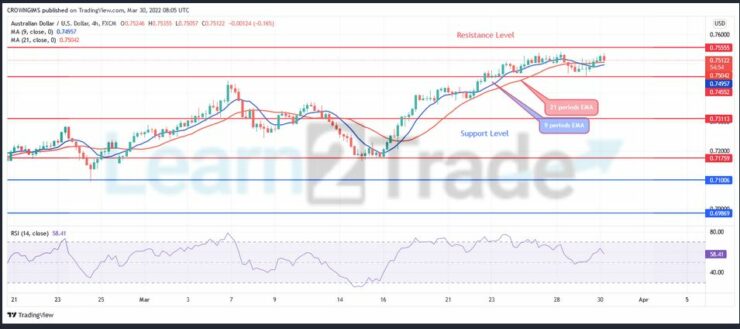
AUDUSD is trading above the 9 periods EMA and 21 periods EMA. The relative strength index period 14 is at 62 levels and the signal lines pointing up to indicate a buy signal.
Source: https://learn2.trade