Hot Features

Recently, in the Bitcoin market (towards the end of September), the price of the crypto experienced high volatility as the high and low of candlesticks (between the 27th and the 28th of September)) ranged from $20,324 and $18,509. Now, we see that the price pull and push are reducing and moving within the range of $19,000. The market’s support and resistance levels are beginning to compress (come closer to each) and the price of the market lingers (for now) at the current price of $19,206.

Information and Interpretations From the Indicators
To confirm the sentiment that the pulls on the price of the market from buyers and sellers are reducing, in the recent market, the upper and the lower bands of the Bollinger band indicator are converging. There is the possibility that after the slight consolidation period, the price will soon move slightly to the upside as the market moves below the basis line of the indicator.
Contrary to this, between yesterday and today, there was a slight bearish divergence appearing between the price action and the Stochastic RSI. That means the sellers are gaining strength and the market may soon go in their favour. However, because stochastic is a much faster indicator, the bearish divergence may just be a fakeout.
From the MACD, the two lines are in the negative market zone of the indicator trying to retrace an upper level. The fast line has crossed the slow line in the negative market zone and they are trying to retrace an upper position. However, the histograms are positive, but their bullishness is reducing as the bullish momentum reduces.
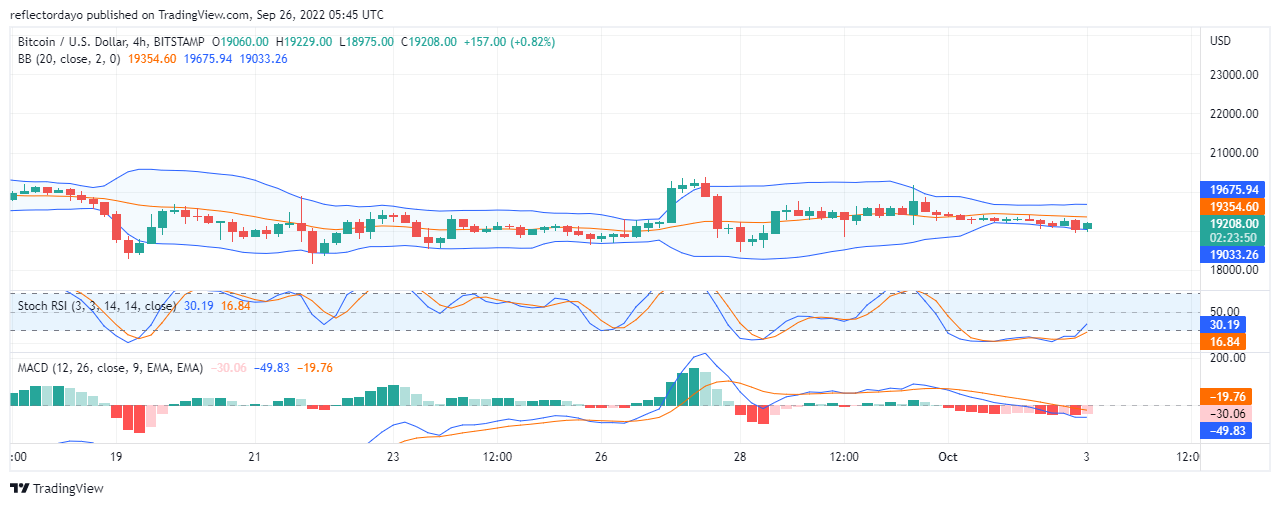
Information From the 4-Hour Chart
In this outlook, the upper and lower bands of the indicator are expanding. Also, the price action (candlesticks) are now resting on the lower band of the indicator and this increases the probability for a soon bullish performance in the market. The stochastic also shows the possibility for a bullish market performance (as the fast line has crossed the slow line since the middle of yesterday’s market) and now it is moving upward into the lower part of the indicator from the oversold region from the. The MACD is showing signs of Bullish recovery.
Learn from the market wizards: Books that will take your trading to the next level