Key Highlights
ETH/USD is in a range-bound move between levels $1,220 and $1,400
Ether will resume an uptrend if it breaks the resistance at $1,400

Ethereum (BTC) Current Statistics
The current price: $1,354.95
Market Capitalization: $166,099,758,445
Trading Volume: $10,498,510,464
Key Resistance Zones: $2,500, $3,300, $4,000
Key Support Zones: $2,000, $1,500, $1,000
Ethereum (ETH) Price Analysis October 6, 2021
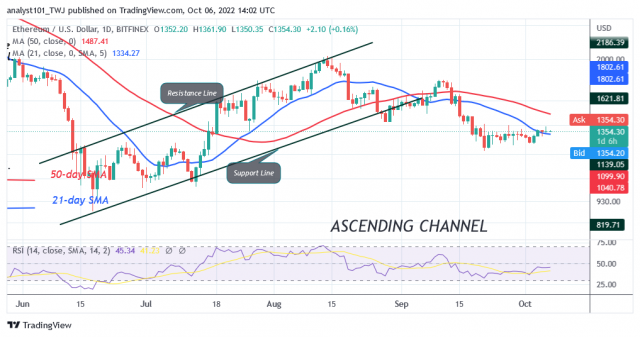
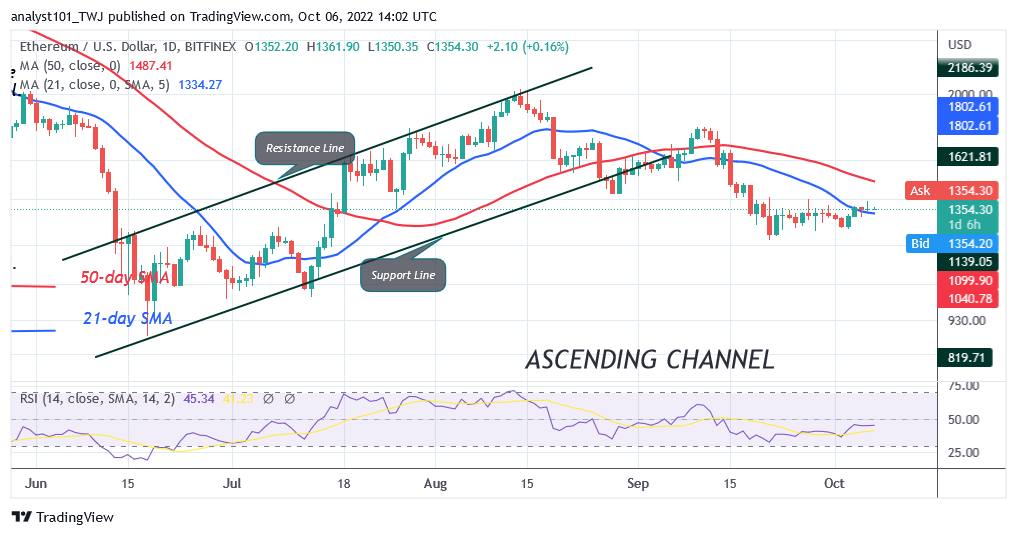
Ethereum(ETH) is in a downtrend but the selling pressure has subsided . Since September 21, the biggest altcoin has been fluctuating between the $1,220 and $1,400 price levels. On October 4, buyers pushed the altcoin above the 21-day line SMA. There is a tendency for the altcoin to rise to the 50-day line SMA if the current support holds above the 21-day line SMA. However, if the current push faces rejection at the $1,400 resistance, Ether will fall and continue its range-bound move within the confined range. Today, the bullish move is facing rejection at the recent high. Ether may decline to the previous low. A break below the $1,220 support will cause the altcoin to reach the low of $1,000 price level.
Ethereum Technical Indicators Reading
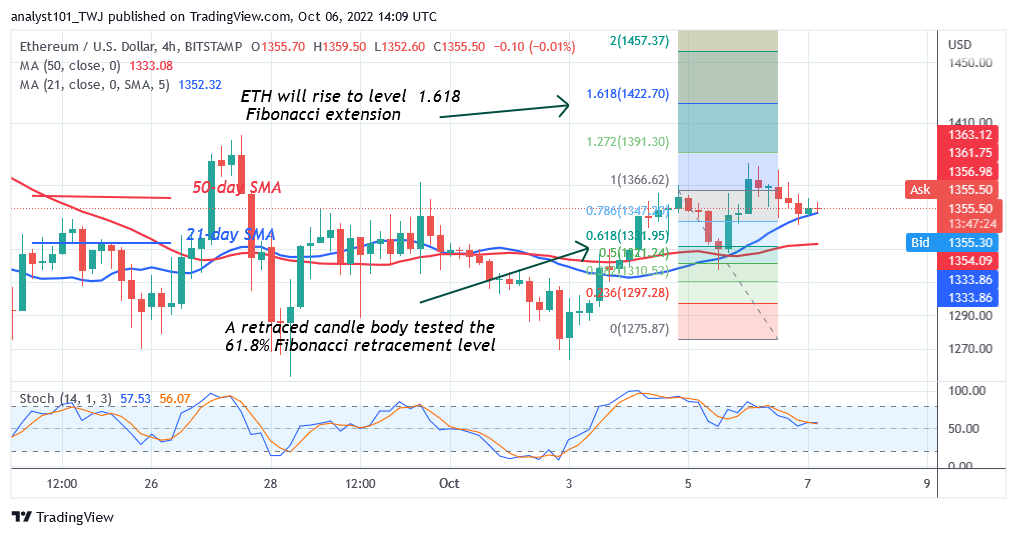
Ether is in a sideways move as it is at level 44 of the Relative Strength Index for period 14. It is in the downtrend zone and capable of further decline. The biggest altcoin will continue its range-bound move as the price bars are between the moving average lines. The altcoin is in a bearish momentum as it is below the 80% range of the daily Stochastic. The price bars are sloping downward indicating the downtrend.
Conclusion
The biggest altcoin is declining after facing rejection at the $1,400 resistance zone. Nonetheless, if it retraces above the $1,300 support, a fresh uptrend is likely to ensue. Nevertheless, ETH/USD will continue its sideways move as long as the range-bound levels remain unbroken.
Learn from market wizards: Books to take your trading to the next level

 Hot Features


