Hot Features

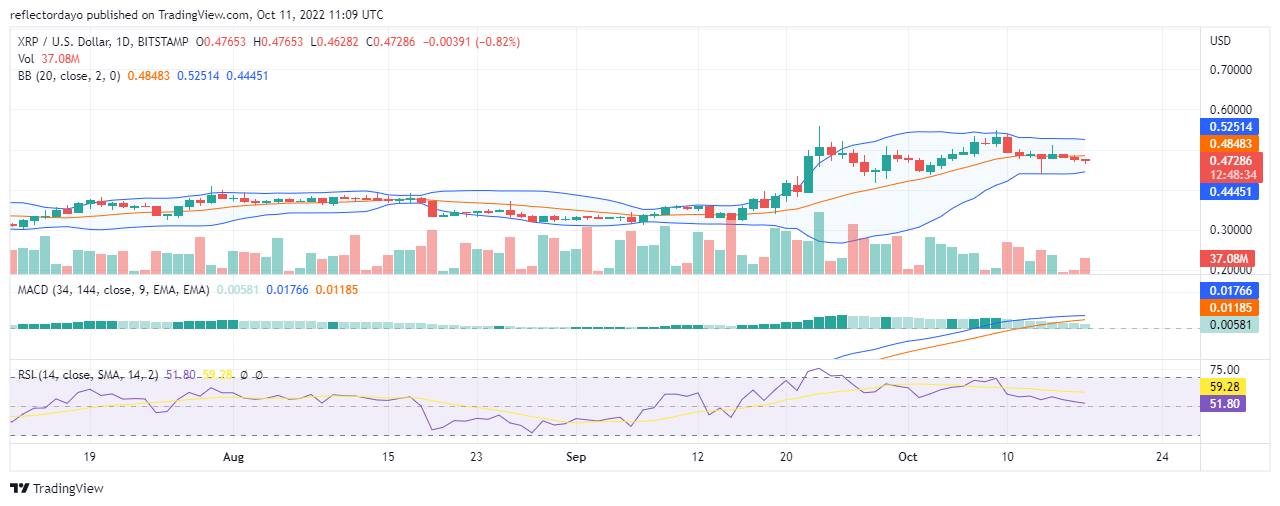
The XRP/USD market settled on the support level of $0.332 on the 20th of August and the market took that as the basis for its consolidating market move. Looking at the market from a wider view, we will discover that the XRP market has experienced more consolidation markets than it has experienced other types of market trends in recent months. But from September 22nd, when the volume of trade begins to increase as traders’ interest also begins to waken, we see the price action shifting to the upside. The bullish candlestick patterns begin to increase significantly until the 23rd of September. On that day, the price reached the height of $0.561. This was where the price was rejected and after the rejection, the market settled at $0.506

Information From the Indicators
The Bears struggled for four days to drive the market in their favour, but it was not possible as the bulls proves themselves to be stronger. The price pullback on the 22nd and the 23rd of September were the results of a correction from the overbought region as the Relative Strength Index portrays it. The MACD histograms have been bullish for quite a while, but they are not increasing in their heights. Due to the price consolidation in the market, the bullish histograms appear in an almost horizontal fashion. But from the 10th till date the histograms have turned faded green due to bearish activities. The price action from the 10th of October till date is moving on the support level of $0.471.
Information from the 4-Hour Chart
We can confirm that the market has settled on the $0.471 price level from this 4-hour chart outlook as we see that bearish advancement has been cut short. After the bearishness of the first session, the following two sessions portray bullish recovery of the price. There is the possibility that the market will continue to trend up judging by this bullish move.
Learn from the market wizards: Books that will take your trading to the next level