Hot Features

After Bitcoin have beaten the $20,000 price level on the 25th and the 26th of October, the next difficult price level is $21,000. Breaking the $20,000 level did not pose much resistance as the $21,000 price level. On the 26th of October, it looked like the bulls would also conquer the $21,000 price level. However, the bulls market was rejected at the $21,000 price level. Most of the investors have targeted $21,000 as the peak – the point at which they would take their profits. And they did it in mass. However, it seems like the force behind the BTC uptrend is still strong. After a brief struggle at the price level, Bulls finds another support level and then they charged at the difficult resistance price level.

Information From the Indicators
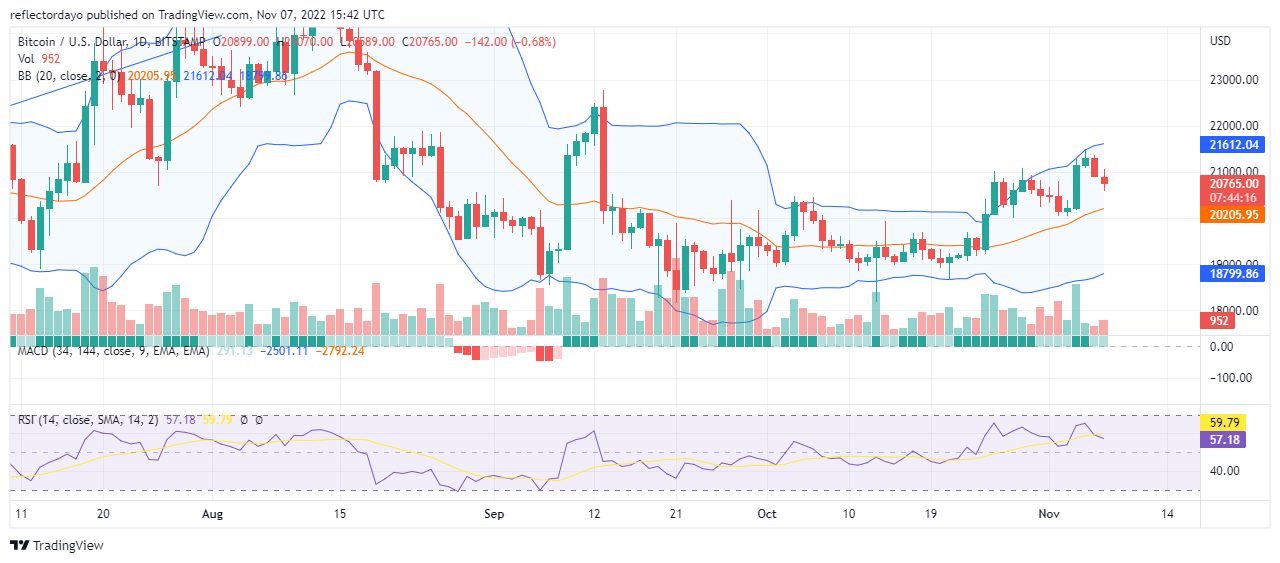
The general direction of the Bollinger band indicator has changed to an upward direction as it responds to the direction of the price. A very strong bullish move on the 4th of November smashed through the $21,000 resistance price level. On that day, bears were nowhere to be found in the market. And the same bullish price continued on the 5th of November. Yet again, above the $21,000 price level, the bulls market was rejected. The candle pattern that represents today’s trading activities suggests that bulls are trying to secure support at the current price (the current price is $20,751).
Information from the 4-hour chart
As the day’s trading session opened, it opened with a kind of bullish support at $20,863. But, this support lost grip in the following session and bears took the market. But in the third 4-hour trading session, bulls finally became strong enough to establish their support which is now the basis for a bullish price recovery. Although the price action is below the Simple Moving Average of the Bollinger indicator and the RSI Line is still in the bearish zone of the indicator (44%), the price is rising again
Learn from the market wizards: Books that will take your trading to the next level