Hot Features

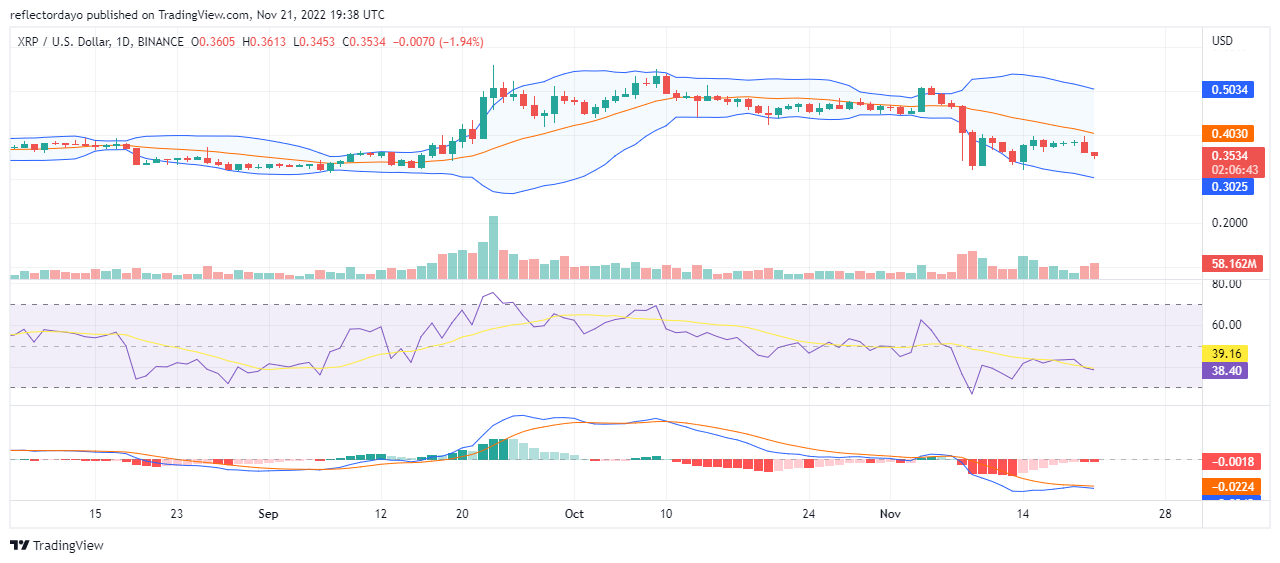
In October, the XRP market consolidated below the 20-day moving average. This was after the bull market faced rejection at the $0.50 price level. The buyers attempted to recapture the $0.5 level, but they were rejected again. This time around, the bearish run brought the price to $0.329. The support was formed from this point and it also became the basis for the strong bull market on November 10. However, the upward-moving market encountered a brick wall at the $0.4 price level. And since then till now, the price could not progress beyond the resistance level.

Information From the Indicator
From November 15 to November 19, there was a brief consolidation trend. As the faceoff between buyers and sellers gets intense; at the climax of the deadlock, the price drops. But then in today’s market, bulls seek a new higher support level at around $0.3564. The Bollinger Indicator has expanded due to the breakout, but as the bears have the upper hand, the bands tilt downward slightly. The RSI line maintains a horizontal movement this is because of the 5-day indecision which later culminates in a bullish price rejection.
Information from the 4-hour chart
From this standpoint, we can see that after the buyers rejected the bearish price, the market went flat. This was because the bulls became strong enough to stop further decline in the price, but they could not advance the bullish price due to massive selling pressure. Bulls seek a support price level. And from that level, they will charge at the resistance level and break it. But for now, the market remains in the territory of the sellers.
Learn from the market wizards: Books that will take your trading to the next level