Hot Features

AI tokens are digital currencies designed to support AI-focused initiatives on blockchain platforms. Primarily, they serve as a means of exchange within AI (artificial intelligence) ecosystems, allowing users to pay for services and engage in platform activities. These tokens also play a vital role in governance, providing holders with decision-making rights to influence the project’s direction. Moreover, AI tokens incentivize user participation by rewarding contributions such as data sharing, computational resources, or application development, fostering the growth of AI protocols.

The following are some of the top ten artificial intelligence (AI) tokens: ICP, INJ, RNDR, GRT, THETA, ROSE, AKT, FET, AGIX, and TFUEL.
Internet Computer (ICP)

The Internet Computer market stands at the forefront of leading AI tokens. As we entered the new year, the ICP market experienced a notable surge in volatility. The bullish momentum, persistent from the previous year into the current one, reached its zenith at $16.00, marking the anticipated onset of a bearish phase. Despite expectations, bullish sentiment continues to influence the market, resulting in fluctuations around the $12.00 price level. Bulls are asserting themselves, particularly around $10.48, leading to a rally toward the $12.00 mark. The prevailing hope is that the market will maintain a bullish trajectory, given the robust support observed at $10.48.
• Current price: $12.16
• 24 hour trading volume: $134,486,403
• 24 gain or loss: 54% gain
• Circulating supply: 456,313,266 ICP
• Market capitalization: 5,546,515,586
• Total supply: 513,729,424 ICP
Injective (INJ)

The Injective end-of-year bullish momentum propelled the market to surpass both the $30 and $34.3 price levels since December, with sustained trading above these thresholds. However, intermittent tests of the $30 price mark have been observed. Notably, price action has exhibited fluctuations around the $40 mark, with a higher frequency of swings below this level than above it. This trend suggests that bears are currently exerting more influence than bulls. Reflecting this stronger bearish sentiment, on January 23, the price action breached the $34 support level.
Presently, the $30 price level serves as a critical support level, and traders are displaying a willingness to buy from this level. This underscores a pivotal point in market dynamics as participants assess and respond to the evolving balance between bullish and bearish forces.
• Current price: $34.03
• 24 hour trading volume: $136,100,855
• 24 gain or loss: 88% gain
• Circulating supply: 88,392,222 INJ
• Market capitalization: 3,000,825,492
• Total supply: 100,000,000 INJ
Render (RNDR)
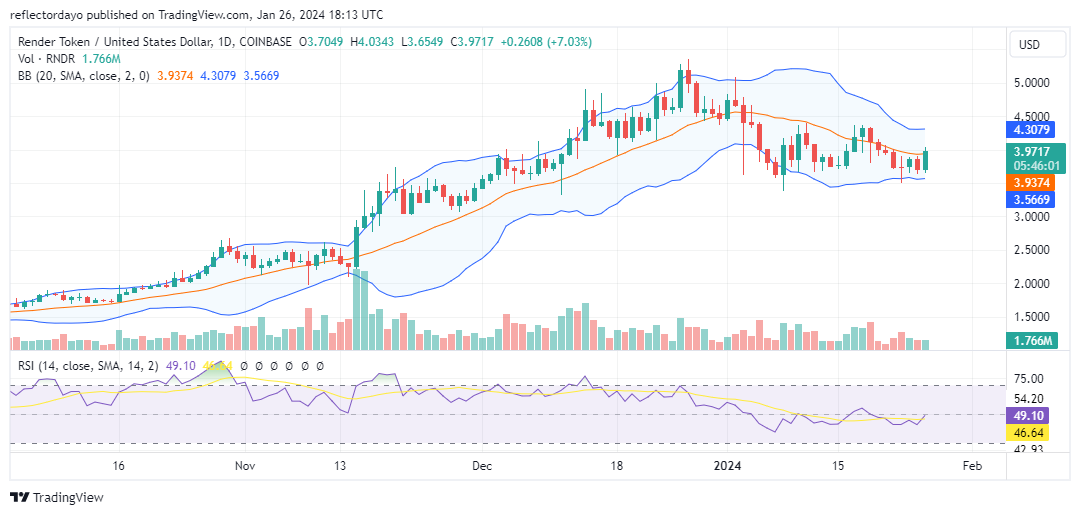
The Render (RNDR) market secured the third position among the top 10 AI tokens. Notably, its recent surge in price has established a stronghold above the $3,500 price mark, precisely around the $3,710 level. This demonstrates the $3,500 level as a robust support, with trading activities consistently maintaining a substantial distance above, affirming the resilience of this identified support.
It is noteworthy that the token’s price trajectory has now aligned with the 20-day moving average curve. This alignment is reflected in the Relative Strength Index (RSI), as the RSI line converges with the 50 level, indicative of the current market dynamics. The bulls are endeavoring to regain control of the market. Despite the market surpassing the $4.00 price level with minimal resistance, the volume of trade indicator reveals a histogram with limited height. Traders should closely monitor this aspect, as the short height of the histograms does not provide strong conviction for the bullish price movement.
• Current price: $4.028
• 24 hour trading volume: $67,416,735
• 24 gain or loss: 88% gain
• Circulating supply: 376,146,336 RNDR
• Market capitalization: 1,494,196,398
• Total supply: 376,146,336
The Graph (GRT)

The GRT token has charted a distinctive trajectory since the beginning of the year, retracing its steps to lower price levels. Intriguingly, the market has established a newfound psychological support at the $0.1400 mark, signaling a potential turning point. Currently, the market is rallying, approaching the 20-day moving average, with today’s candlestick proving to be particularly significant.
However, a noteworthy challenge surfaces in the form of resistance at the $0.16 mark, presenting an obstacle to upward corrections. This resistance is underscored by the standoff between bulls and bears on January 21, culminating in a bearish breakout. Presently, with the bull market gaining strength from the $0.140 price level, the market has turned upward. Investors and traders should closely monitor these developments as they assess potential trends and market dynamics.
• Current price: $0.158
• 24 hour trading volume: $41,316,813
• 24 gain or loss: 21% gain
• Circulating supply: 9,389,759,156 GRT
• Market capitalization: 1,478,001,421
• Total supply: 10,793,365,466 GRT
Theta Network (THETA)

The Theta Network token has experienced a distinctive journey, marked by pronounced declines but also demonstrating substantial profitability compared to its counterparts in the current assessment within the daily chart outlook. At present, the token maintains a position above the $0.9400 threshold, showcasing resilience.
Traders strategically intervened around the $1.00 price threshold to counter the significant bearish momentum witnessed since the beginning of the year. However, the bulls had to establish solid ground at the $0.94 price level after testing the $0.88 level.
Now, with the market situated below the crucial $1.00 price level, it encounters substantial resistance in the area. This resistance may impede the recovery process of the market, necessitating careful consideration by investors and traders as they navigate potential trends and market dynamics.
• Current price: $0.9849
• 24 hour trading volume: $13,281,195
• 24 gain or loss: 22% gain
• Circulating supply: 1,000,000,000 THETA
• Market capitalization: 985,118,797
• Total supply: 1,000,000,000 THETA
Oasis Network (ROSE)

This market, like several others, commenced the New Year with a downward trend. Despite the prevailing bearish market conditions, the bulls have consistently demonstrated their intent to drive a price rally. However, their efforts have resulted in the formation of lower peaks. Notably, bullish attempts around the $0.12 price level aimed at rallying the price proved unsuccessful, leading to a lower peak at $0.135. This market dynamic repeated itself at both the $0.11 and $0.10 price levels.
As of now, the certainty of the market rallying above the 20-day moving average remains uncertain, given that today’s daily candlestick already exhibits an upper shadow—a potential indication of bearish activities. This raises the possibility that the bearish trend may persist in the near term. Investors and traders should exercise caution and monitor the evolving market conditions closely.
• Current price: $0.11
• 24 hour trading volume: $30,205,171
• 24 gain or loss: 74% gain
• Circulating supply: 6,713,599,876 ROSE
• Market capitalization: 698,264,417
• Total supply: 10,000,000,000 ROSE
Akash Network (AKT)
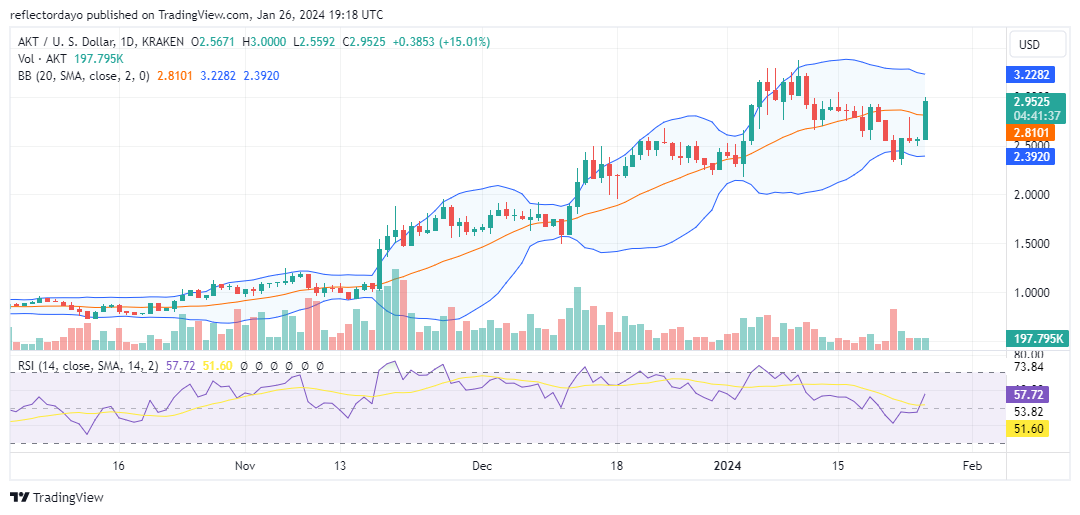
The AKT market’s price trajectory has been characterized by ascending peaks since November. Roughly four sessions ago, the market tested a pivotal support level, specifically the support level established on January 2nd. Bullish sentiment concentrated around this support has facilitated the upward movement of the price action, surpassing the 20-day moving average and currently approaching the $3.00 price mark.
As a confirmation of today’s daily price action, the Relative Strength Index (RSI) line indicates a rapid appreciation in buying momentum. Despite this positive momentum, the bull market will encounter significant resistance around the $3.00 price level. Investors should remain vigilant and closely monitor the market as it navigates potential challenges and opportunities in this critical price range.
• Current Price: $2.958
• 24-hour Trading Volume: $5,404,122
• 24-hour Gain or Loss: 52% gain
• Circulating Supply: 226,182,122 AKT
• Market Capitalization: $668,536.656
• Total Supply: 226,182,122 AKT
Fetch.ai (FET)
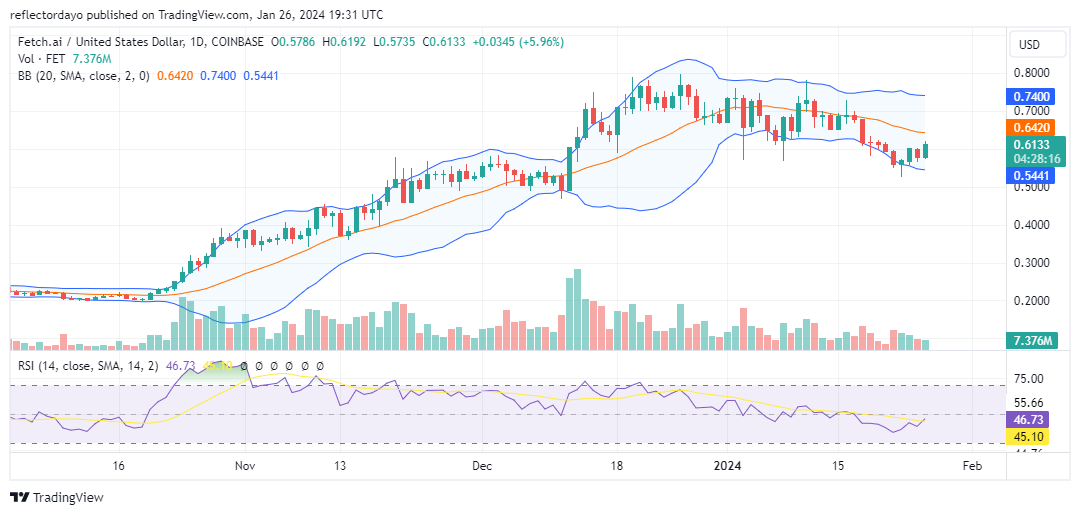
In the recent session, price dynamics underwent a retracement, bringing the price to the $0.6045 support level. This market development established a robust support level, acting as a barrier against further bearish momentum. This positioned the bullish side of the market to engage in a battle with the bears around the $0.7000 price level. However, given that the market swings exhibit a bias towards the bears rather than the bulls, it signifies that the bears have the upper hand. In response, the bulls reevaluated their strategy and intervened at the $0.55 price level.
Presently, the market action is retracing the 20-day moving average as the bulls strive to regain momentum against the prevailing bearish pressure. Investors should closely monitor this evolving situation, considering the interplay between bulls and bears in shaping the market trend.
• Current Price: $0.6156
• 24-hour Trading Volume: $43,032,453
• 24-hour Gain or Loss: 5.99% Gain
• Circulating Supply: 831,606,767 FET
• Market Capitalization: $512,071,251
• Total Supply: 1,152,997,575 FET
SingularityNET AGIX
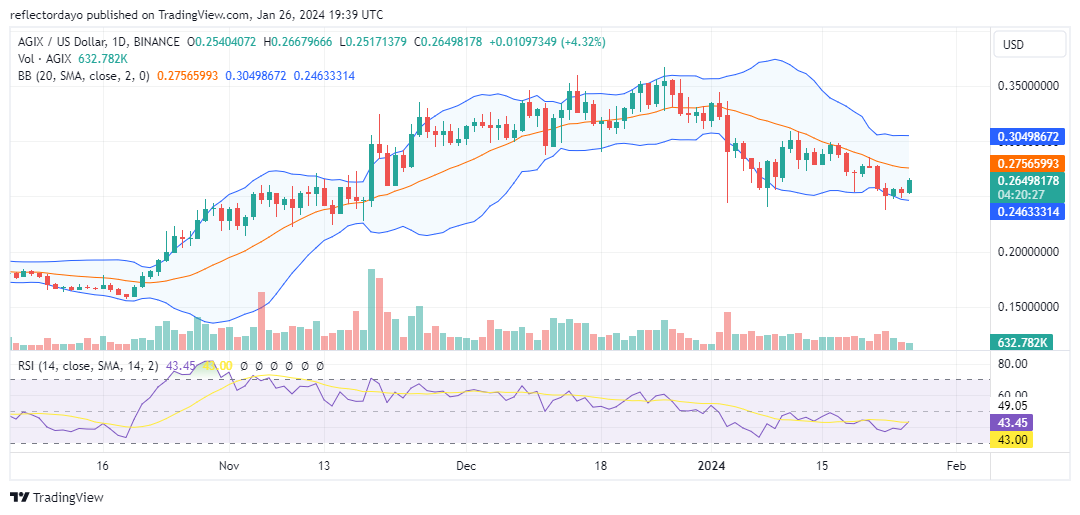
As we transition into the new year, this market has established a lower price channel, forming a rectangle pattern. This pattern mirrors the same rectangle observed in December of the previous year. During that period, the price fluctuated between the $0.300 and $0.3500 price levels. However, in the new year, the pattern has shifted to range between the $0.25 and $0.30 price levels.
Additionally, despite an upward rally in the price action, it remains below the 20-day moving average. This suggests that bears may still retain a degree of dominance in the market. Investors should closely monitor these price dynamics and consider the implications of the ongoing pattern as they assess potential market trends.
• Current Price: $0.2649
• 24-hour Trading Volume: $5,463,573
• 24-hour Gain or Loss: 25%
• Circulating Supply: 1,252,742,236 AGIX
• Market Capitalization: $323.50 million
• Total Supply: 2,000,000,000 AGIX
Theta Fuel (TFUEL)

The downturn commenced on January 3rd, as bullish momentum breached the psychological barrier at the $0.05000 mark, leading to a substantial price surge that peaked above the $0.06 price level within the same daily trading session. This particular market dynamic could be a contributing factor that emboldened the bears, subsequently driving the price below the $0.045 level.
Approximately four sessions ago, the bulls regathered strength from the $0.040 level, initiating an upward trend. Since then, the market has been making efforts to rally and converge with the 20-day moving average. Investors should carefully observe these developments, considering the interplay between bulls and bears, as it may influence future market trends.
- Current Price: $0.0427
- 24-hour Trading Volume: $3,344,739
- 24-hour Gain or Loss: 4.44%
- Circulating Supply: 6,427,843,708 TFUEL
- Market capitalization: $276,133,731
- Total Supply: 6,427,663,419 TFUEL