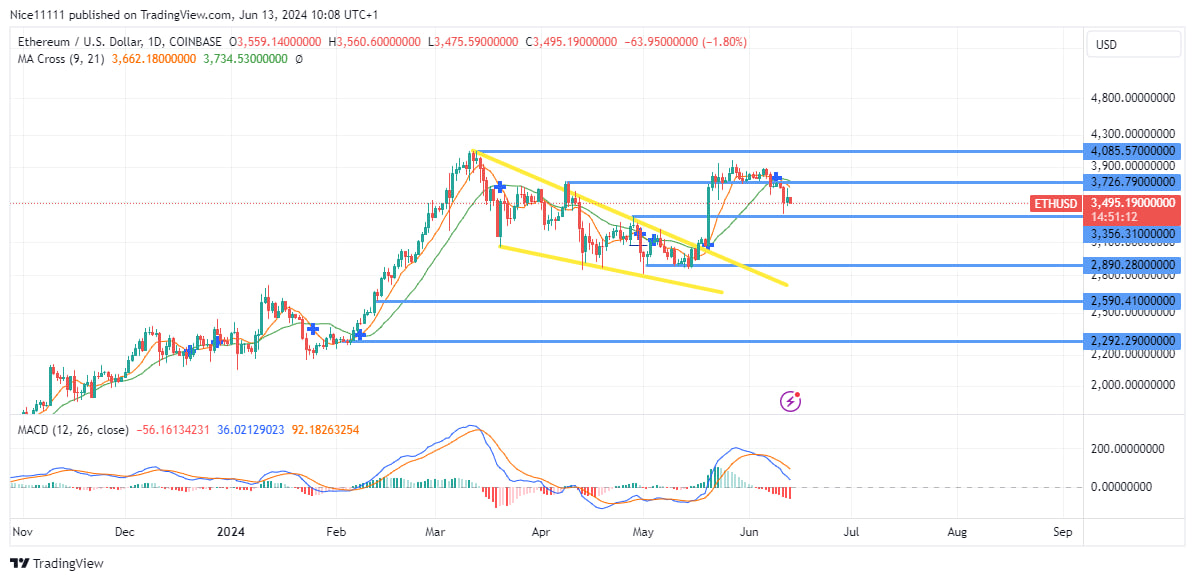
Ethereum’s recent price action displayed a bullish flag pattern on the daily chart, setting the stage for an impactful mid-May breakout. The cryptocurrency surged impressively from $3100.0 to $3726.0 within a single day, driven by robust bullish momentum. However, this upward movement encountered formidable resistance around the $3726.80 level, where buyers faced challenges in advancing towards the next significant zone at $4085.0. As a result, Ethereum underwent a retracement phase, finding support at $3356.0 amid ongoing market dynamics.
Ethereum Key Levels
- Supply Levels: $3726.0, $4085.0
- Demand Levels: $3356.0, $2890.0
 What Are the Indicators Saying?
In May, preceding the bullish breakout, MACD indicators highlighted oversold conditions, signalling a potential reversal. The subsequent bullish expansion confirmed the breakout from the flag pattern, with Moving Averages (Periods 9 and 21) initially diverging to underscore a clear directional move. However, their convergence near the $3726.80 resistance level marked a shift to a consolidative phase, influencing Ethereum’s price action towards the support level at $3356.0.
The current pullback is seen as a crucial phase where Ethereum seeks to gather momentum from lower demand levels to potentially resume its upward trajectory. Traders and analysts are closely monitoring these support and resistance levels for indications of future price movements, as Ethereum navigates through a dynamic market environment.
Learn from market wizards: Books to take your trading to the next level

 Hot Features


