ADVFN Logo ADVFN

We could not find any results for:
Make sure your spelling is correct or try broadening your search.

Trending Now

Toplists

It looks like you aren't logged in.
Click the button below to log in and view your recent history.

Hot Features

Registration Strip Icon for pro Trade like a pro: Leverage real-time discussions and market-moving ideas to outperform.

Bitcoin (BTCUSD) Shows Bearish Pressure As Indicators Signal Downward Trend

Share On Facebook
share on Linkedin
Print

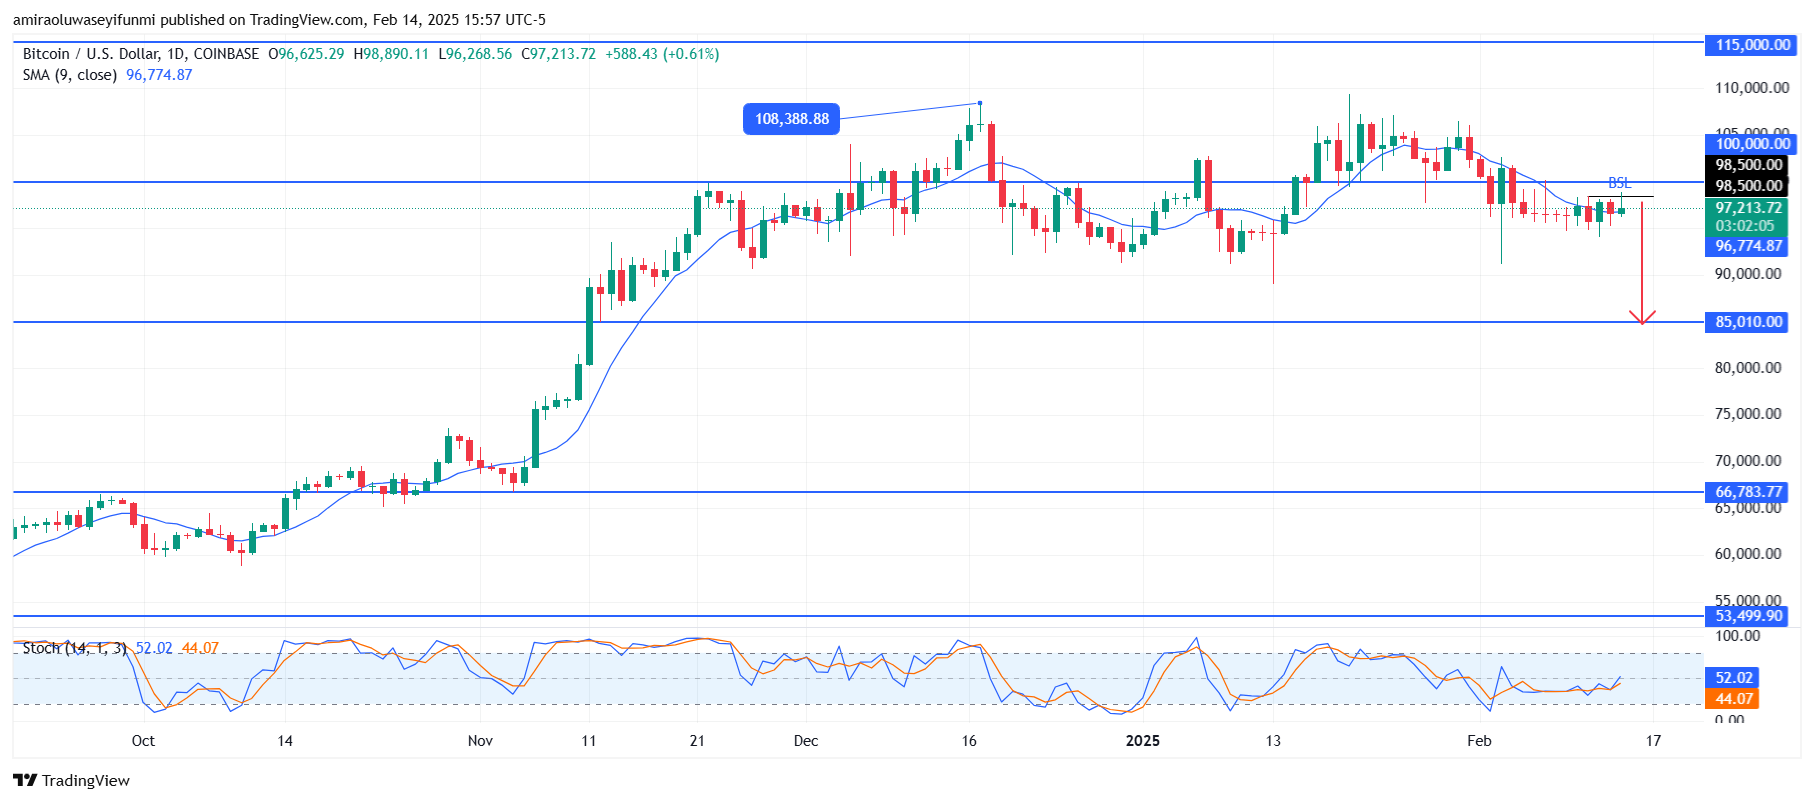
BTCUSD shows bearish pressure as indicators signal a downward trend. Price action highlights that Bitcoin has consistently faced strong resistance at the $100,000 level, with the recent rejection from that zone leading to lower highs. A break below the $100,000 resistance further confirms bearish dominance. Multiple attempts to close above this key resistance have failed, while the formation of bearish candles near the support line suggests selling pressure is increasing. The recent candle formation also hints at a potential liquidity grab before a further drop.

©

Projection-wise, if the bearish trend continues, BTCUSD could find its next support around $85,000, with a breach below this level opening the door to further declines toward $66,800. The bearish structure remains intact unless a significant reversal pushes the price above the $100,000 resistance. Traders may need to watch for a decisive break below $90,000 as a trigger for further downside, while any bounce from current levels might only be temporary corrections in a larger bearish trend.


BTC Key Level

Supply Levels: $100,000, $108,400, $115,000
Demand Levels: $85,000, $66,800, $53,500

What Are the Indicators Saying?

The BTCUSD daily chart reveals a bearish sentiment through its indicators. The 9-day Simple Moving Average (SMA) is currently at $96,770, sitting just above the current price of $97,200, acting as a dynamic resistance level. The Stochastic Oscillator, with values at 51.9 and 44.0, is hovering in the mid-zone but appears to be curling downward. This indicates a potential continuation of bearish momentum as the price struggles to gain bullish strength.

Learn from market wizards: Books to take your trading to the next level.


CLICK HERE TO REGISTER FOR FREE ON ADVFN, the world's leading stocks and shares information website, provides the private investor with all the latest high-tech trading tools and includes live price data streaming, stock quotes and the option to access 'Level 2' data on all of the world's key exchanges (LSE, NYSE, NASDAQ, Euronext etc).

This area of the ADVFN.com site is for independent financial commentary. These blogs are provided by independent authors via a common carrier platform and do not represent the opinions of ADVFN Plc. ADVFN Plc does not monitor, approve, endorse or exert editorial control over these articles and does not therefore accept responsibility for or make any warranties in connection with or recommend that you or any third party rely on such information. The information available at ADVFN.com is for your general information and use and is not intended to address your particular requirements. In particular, the information does not constitute any form of advice or recommendation by ADVFN.COM and is not intended to be relied upon by users in making (or refraining from making) any investment decisions. Authors may or may not have positions in stocks that they are discussing but it should be considered very likely that their opinions are aligned with their trading and that they hold positions in companies, forex, commodities and other instruments they discuss.

Comments are closed

 
Do you want to write for our Newspaper? Get in touch: newspaper@advfn.com