Hot Features

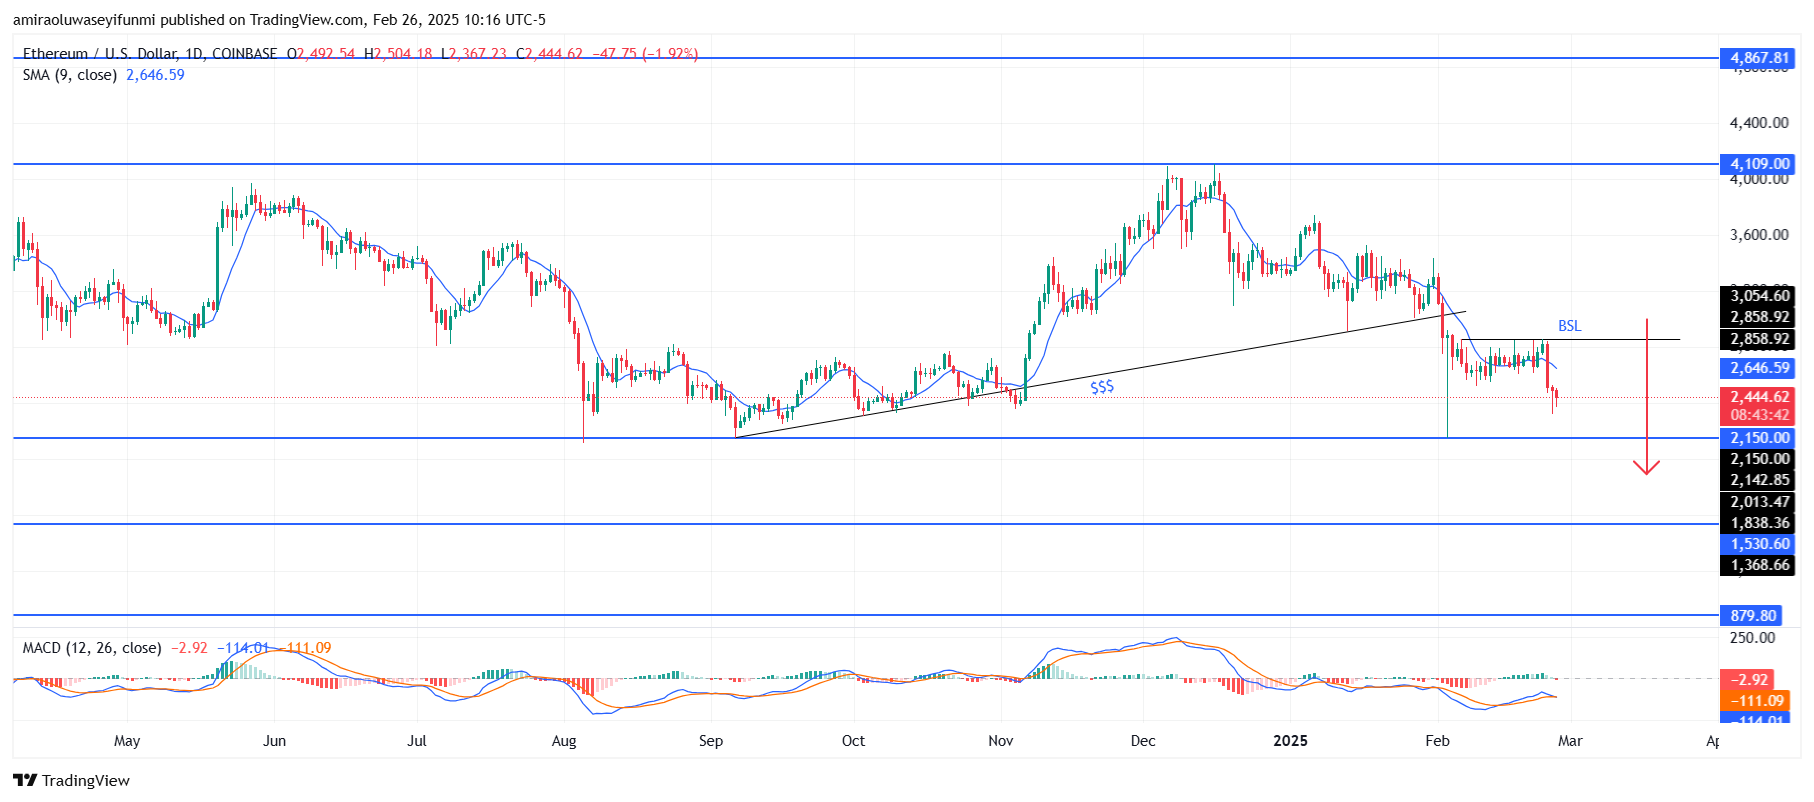
ETHUSD bearish move strengthens at critical support levels. ETHUSD pair is witnessing an increase in bearish momentum as it trades below significant support thresholds. The daily chart indicates a breakdown below the $2,650 level, which had previously functioned as a support zone. The formation of equal highs around $2,860 marks a transition from bullish to bearish sentiment, as the market tested this level and subsequently faced rejection, solidifying it as resistance. The next pivotal support level is identified at $2,150, with potential for further declines toward $1,530 should the bearish momentum continue.

In the short term, ETHUSD may see a temporary bullish retracement towards the $2,650 mark before resuming its downward trajectory. Following the recent liquidity grab at the equal high, a decline towards $2,150 appears likely, with a further extension towards $1,530 possible. A decisive daily close above $2,650 would negate the immediate bearish outlook and may indicate a potential reversal. However, unless the price effectively breaches the $2,860 resistance level, the overarching trend maintains a bearish bias.
ETH Key Levels
Supply Levels: $2860, $4100, $4870
Demand Levels: $2150, $1530, $880
 What Are the Indicators Saying?
Current technical indicators illustrate a robust bearish momentum in the market. The 9-day Simple Moving Average (SMA) at $2,650 is positioned above the current price, functioning as dynamic resistance. Additionally, the Moving Average Convergence Divergence (MACD) indicator reinforces the bearish outlook, with the MACD line crossing below the signal line and histogram bars reflecting negative momentum. This trend suggests that further downside movement is anticipated unless a shift in momentum occurs.
Learn from market wizards: Books to take your trading to the next level