Hot Features

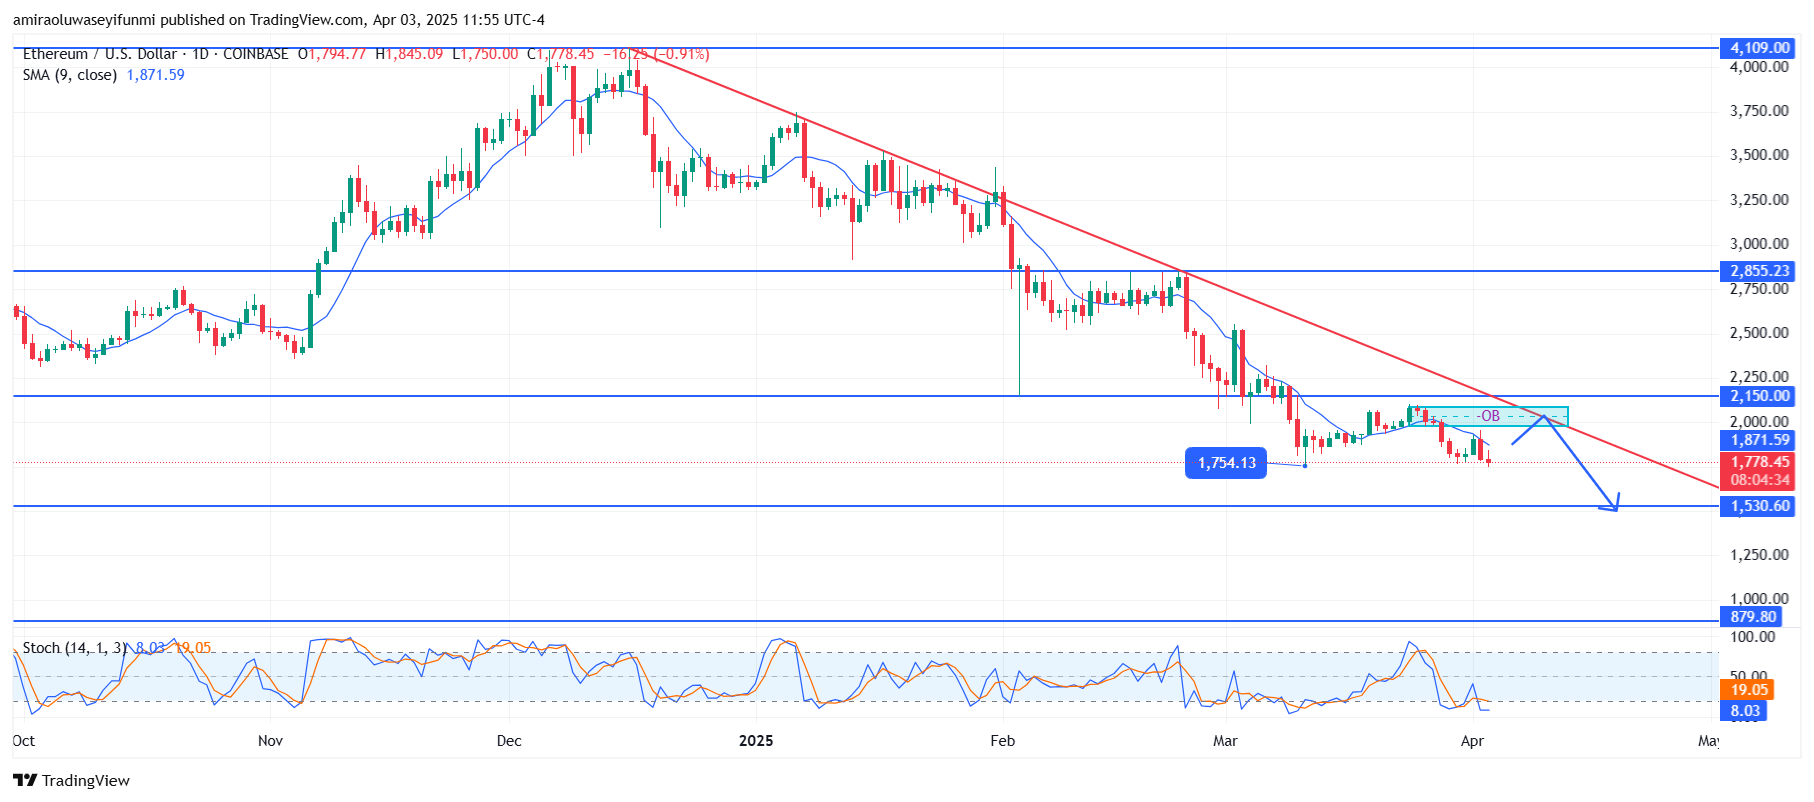
ETHUSD continues its downtrend with bearish signals from key indicators. Price action shows a descending trendline from the previous high, acting as strong resistance. ETHUSD recently tested the $2,150 supply zone, where it faced rejection, leading to continued selling pressure. The formation of lower highs and lower lows further reinforces the bearish structure. The last significant low at $1,750 has been revisited, and a failure to hold this level could open the door for further declines.

Given the current market structure, ETHUSD is likely to continue its downward trajectory. If the price fails to reclaim the $1,870 level, the next major support lies around $1,530, where buyers may attempt to stabilize the market. A confirmed breakdown below this level could accelerate the decline toward $1,250. Any potential recovery would require a break above the $2,150 resistance zone and the descending trendline.
ETH Key Levels
Supply Levels:. $2150, $2860, $4110
Demand Levels: $1750, $1530, $880
https://www.tradingview.com/x/DJt79Y3n/
What are the indicators saying?
The key indicators reveal that the overall trend of the market is strongly bearish. The 9-day Simple Moving Average (SMA) is positioned above the current ETHUSD price, confirming the ongoing bearish trend. The Stochastic Oscillator is deep in the oversold region, with the %K and %D lines hovering around 8 and 19, respectively, suggesting that the market is weak. A lack of bullish crossover in this zone implies that selling pressure remains strong, reducing the likelihood of a near-term reversal.
Learn from market wizards: Books to take your trading to the next level