Hot Features

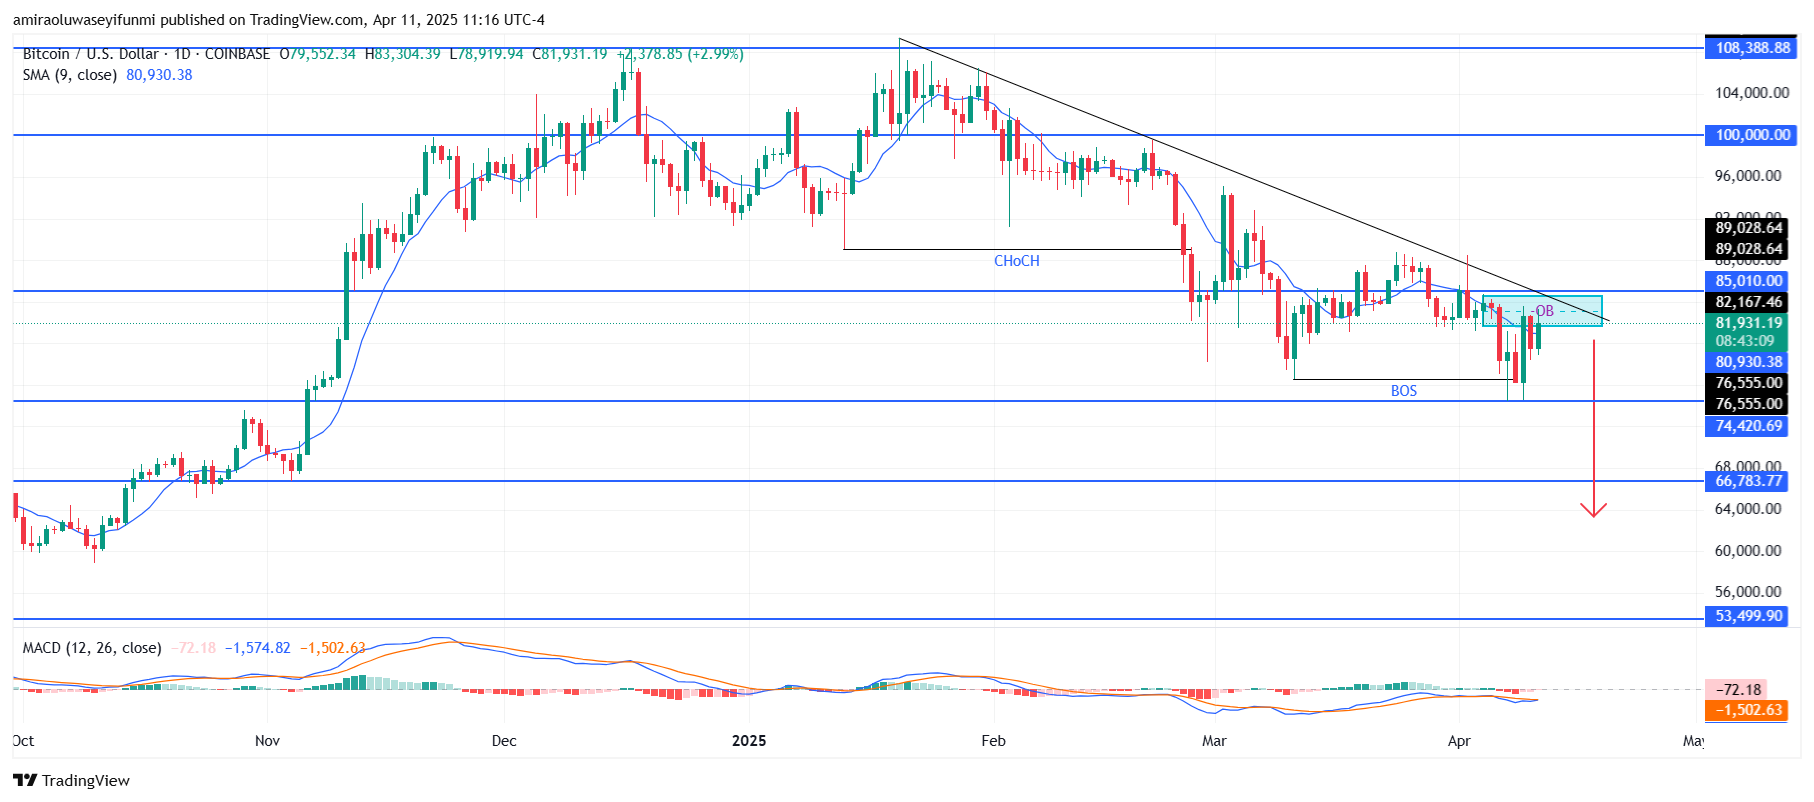
BTCUSD is trending lower amidst key resistance and shifting momentum. Price action analysis reveals a clear bearish structure characterized by lower highs and lower lows. A significant rejection occurred at the $85,010 level, where the price encountered strong resistance, forcing a decline. Following a breakdown below $76,560 swing low, the market struggled to reclaim previous highs, with sellers maintaining control. Recent price actions indicate bearish divergence during attempted rallies, suggesting that buyer interest is waning and reinforcing the overall downward trend in BTCUSD.

Looking ahead, the bearish projection indicates that BTCUSD could continue to test lower support levels in the coming sessions. A further decline toward the $74,420 area is anticipated as selling pressure intensifies, and if momentum persists, the price might drop to the $66,780 level. Beyond this, a significant demand zone is expected to form around $53,500, which could act as a floor if buyers step in. Until bullish momentum returns and BTCUSD manages to break above the diagonal resistance, the overall technical outlook remains clearly bearish.
BTC Key Levels
Supply Levels: $85,010, $100,000, $108,390
Demand Levels: $74,420, $66,780, $53,500
What are the indicators saying?
The MACD (Moving Average Convergence Divergence) indicator on the daily chart is firmly in a bearish setup, with the MACD line remaining below the signal line and both lines trending downward consistently. The histogram is printing persistent negative values, reinforcing the prevailing downtrend.
The RSI (Relative Strength Index) currently sits near 40, indicating that the bearish momentum is strong yet the market is not deeply oversold. Additionally, the 9-period SMA is positioned around $80,930, acting as dynamic resistance, while the 50-period SMA is flattening near $84,410, further supporting the technical weakness in the current price action.
Learn from market wizards: Books to take your trading to the next level.