
 Hot Features

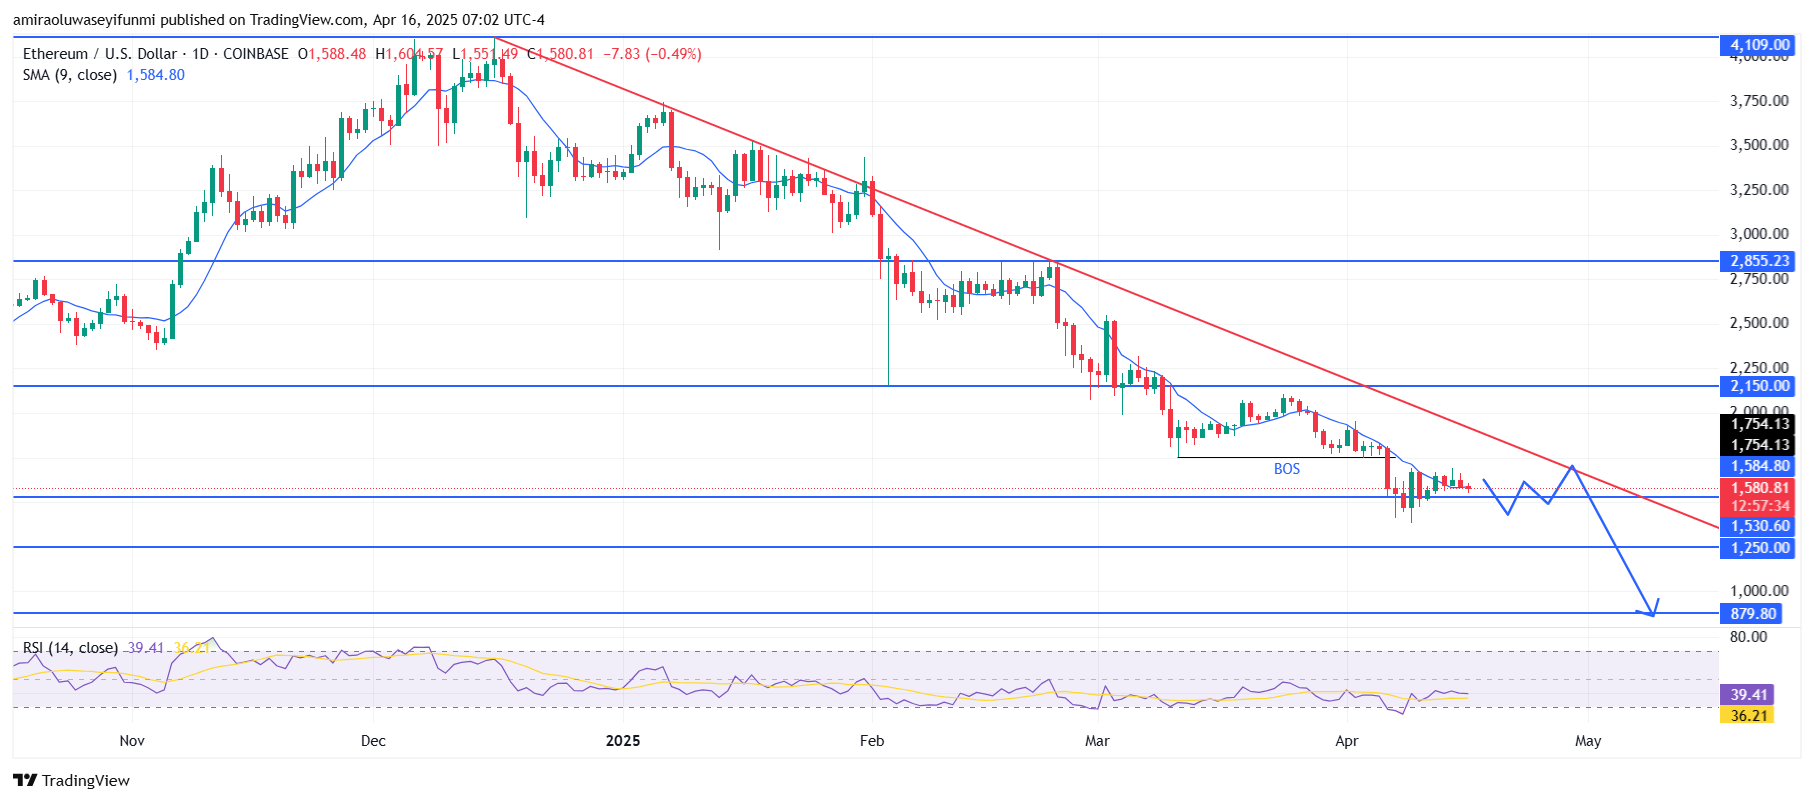
ETHUSD remains under bearish pressure, with lower lows expected. Prices have respected a well-defined descending trendline stretching from the February highs. After a temporary bullish breakout marked as BOS (Break of Structure), the price quickly slipped back under the $1,750 resistance zone and is now consolidating below the trendline. The breakout from $1,750 and repeated failure to close above $1,530 support the view that sellers are in control. The $1,530 level remains an interim support, but the overall structure still favors a downward continuation.

Looking ahead, if ETHUSD fails to break and hold above the descending trendline, the price may slide further toward $1,250. A break below $1,530 could accelerate bearish movement, opening the door for a test of $880. A bounce could occur around that level due to historical demand, but as long as ETHUSD trades below $1,750 and remains under the trendline, the bearish outlook remains dominant.
ETH Key Levels
Supply Levels: $2150, $2860, $4110
Demand Levels: $1530, $1250, $880
What are the indicators saying?
The ETHUSD daily chart reveals strong bearish momentum, supported by technical indicators. The price is currently trading around $1,580, just below the 9-day Simple Moving Average (SMA) at approximately $1,590, which has acted as dynamic resistance in recent sessions.
The Relative Strength Index (RSI) remains weak at 39.42, indicating that bearish pressure persists and buyers lack momentum to reverse the current trend. This suggests that ETH could continue to struggle beneath key resistance levels in the near term.
Learn from market wizards: Books to take your trading to the next level


