ADVFN ADVFN

We could not find any results for:
Make sure your spelling is correct or try broadening your search.

Trending Now

Toplists

It looks like you aren't logged in.
Click the button below to log in and view your recent history.

Hot Features

Registration Strip Icon for default Register for Free to get streaming real-time quotes, interactive charts, live options flow, and more.

Bitcoin (BTCUSD) Surges Higher as Bulls Take Firm Control of Momentum

Share On Facebook
share on Linkedin
Print

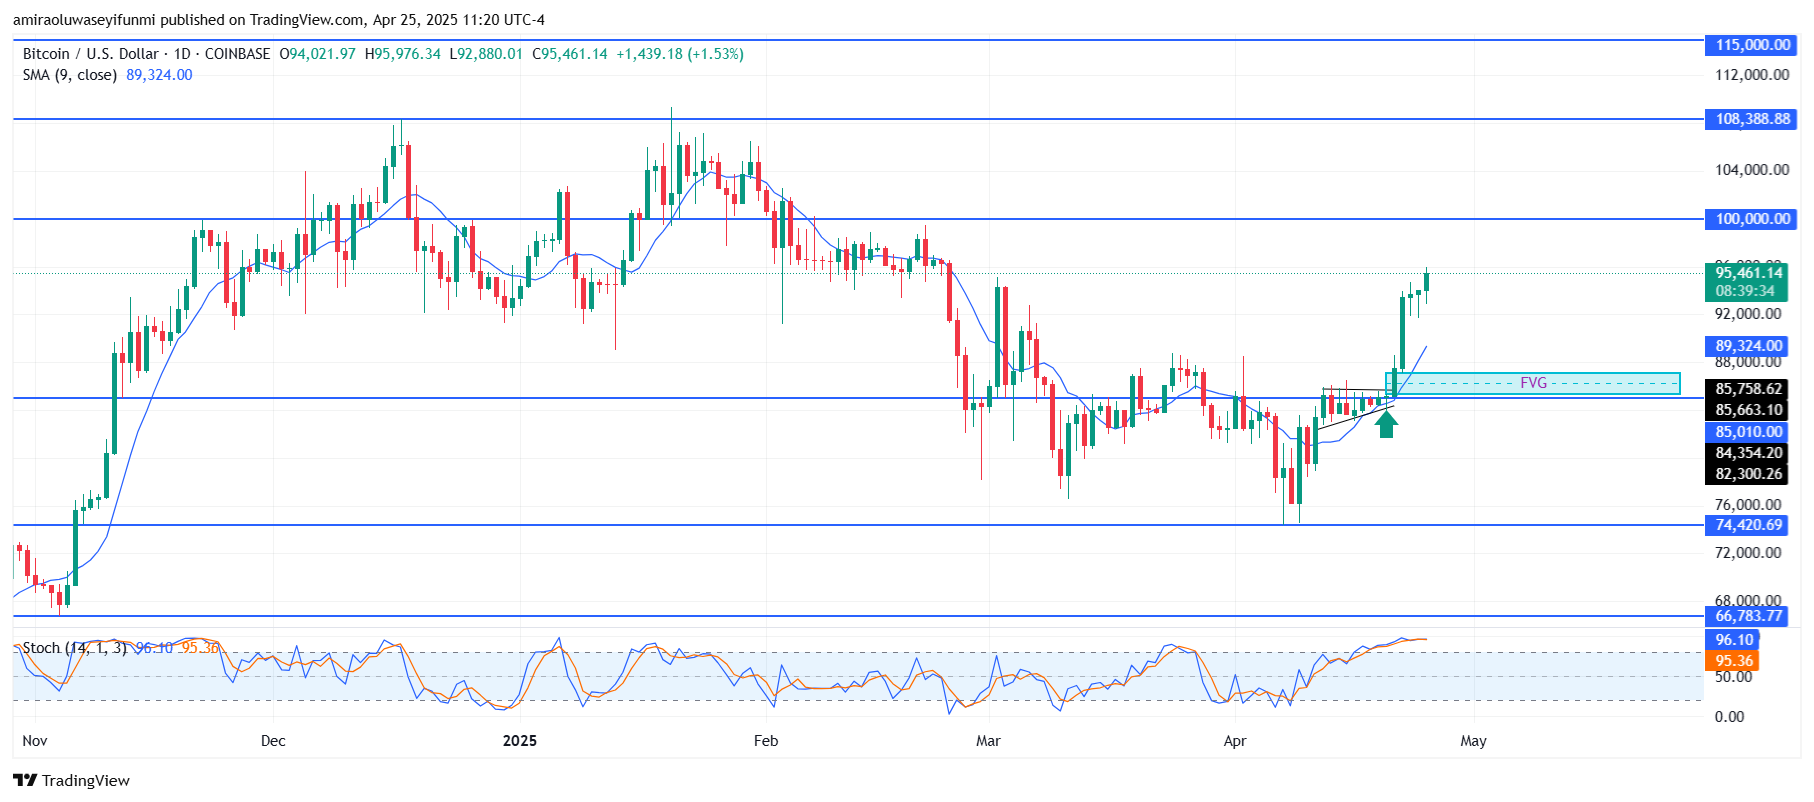
BTCUSD surges higher as the bulls take firm control of momentum. Price action shows a clear breakout above previous resistance levels, particularly the $89,330 region. After consolidating within a tight range earlier in April, BTCUSD broke out decisively, filling the Fair Value Gap (FVG) around $85,760 to $85,660. A significant bullish engulfing pattern emerged from this zone, pushing the price sharply higher.

©

The market structure has shifted to higher highs and higher lows, another strong confirmation of bullish control. Support levels now rest at $85,010, with the current price trading around $95,490. The clear and clean breakout suggests that sellers are overwhelmed, and buyers are confident in pushing prices higher. Looking ahead, BTCUSD is well positioned for a continued bullish advance. The next major psychological resistance is seen around $100,000. Beyond that, targets at $108,390 and ultimately $115,000 could come into focus if the current momentum is sustained.

BTC Key Levels

Supply Levels: $100,000, $108,390, $115,000
Demand Levels: $85,010, $74,420, $66,780

Bitcoin (BTCUSD) Surges Higher as Bulls Take Firm Control of Momentum

What are the indicators saying?

The BTCUSD pair is displaying strong bullish momentum, as indicated by key technical indicators. The 9-day Simple Moving Average (SMA) currently sits around $89,330, offering dynamic support and confirming the strength of the uptrend. Price action is trading well above this moving average, reflecting buyers’ dominance.

Additionally, the Stochastic Oscillator is hovering around 96, suggesting overbought conditions. However, in strong bullish trends, such overbought readings can persist for extended periods without causing an immediate reversal. This supports the case for further upside, even though minor pullbacks may occur.


Learn from market wizards: Books to take your trading to the next level


CLICK HERE TO REGISTER FOR FREE ON ADVFN, the world's leading stocks and shares information website, provides the private investor with all the latest high-tech trading tools and includes live price data streaming, stock quotes and the option to access 'Level 2' data on all of the world's key exchanges (LSE, NYSE, NASDAQ, Euronext etc).

This area of the ADVFN.com site is for independent financial commentary. These blogs are provided by independent authors via a common carrier platform and do not represent the opinions of ADVFN Ltd. ADVFN Ltd does not monitor, approve, endorse or exert editorial control over these articles and does not therefore accept responsibility for or make any warranties in connection with or recommend that you or any third party rely on such information. The information available at ADVFN.com is for your general information and use and is not intended to address your particular requirements. In particular, the information does not constitute any form of advice or recommendation by ADVFN.COM and is not intended to be relied upon by users in making (or refraining from making) any investment decisions. Authors may or may not have positions in stocks that they are discussing but it should be considered very likely that their opinions are aligned with their trading and that they hold positions in companies, forex, commodities and other instruments they discuss.

Comments are closed

 
Do you want to write for our Newspaper? Get in touch: newspaper@advfn.com