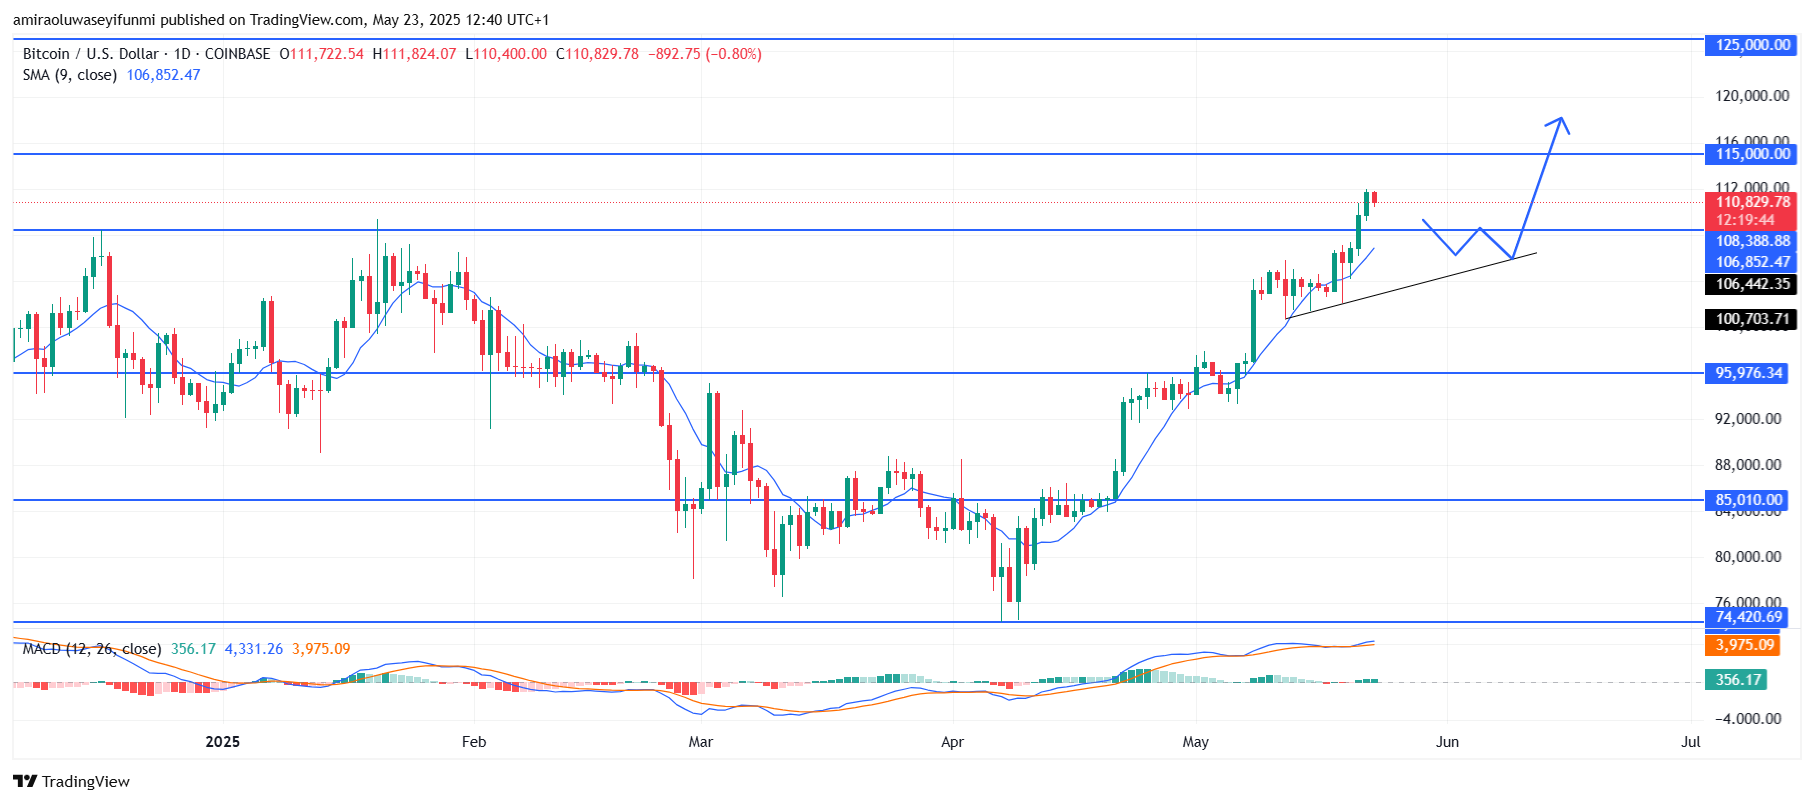
BTCUSD holds its bullish structure with continuation likely toward resistance zones. Price action confirms bullish dominance as BTCUSD continues to print higher highs and higher lows. After breaking through the key resistance zone at $108,390, the price surged past $110,000 and is now consolidating slightly below the $112,000 level. The ascending trendline and the SMA have acted as solid support, catching multiple pullbacks and fueling continuation rallies. The resistance at $108,390 may now function as a strong support zone, with further validation from the price’s respect for the trendline.

Looking ahead, BTCUSD is poised to continue its upward move. A brief consolidation or minor pullback toward the $108,400–$106,850 range could provide a fresh buying opportunity before the next leg higher. Once the price breaks above $112,000 convincingly, it may target the next significant resistance of around $115,000. If bullish momentum persists beyond that, an extended rally toward $125,000 becomes increasingly likely. As long as the price holds above the ascending trendline and the $106,440 support zone, the broader structure remains bullish with a high probability for further upside.
 BTC Key Levels
Supply Levels: $108,390, 115,000, $125,000
Demand Levels: $95,980, $85,010, $74,420
What are the indicators saying?
The BTCUSD market remains in a strong bullish position, supported by technical indicators. The 9-day Simple Moving Average (SMA), currently around $106,850, is trending upward and acting as dynamic support, indicating sustained buying pressure.
The Moving Average Convergence Divergence (MACD) also reinforces this sentiment, with the MACD line positioned above the signal line and histogram bars staying in positive territory, signaling momentum remains in favor of the bulls. Both indicators together suggest the current trend is healthy and has room for further growth.
Learn from market wizards: Books to take your trading to the next level

 Hot Features


