Hot Features

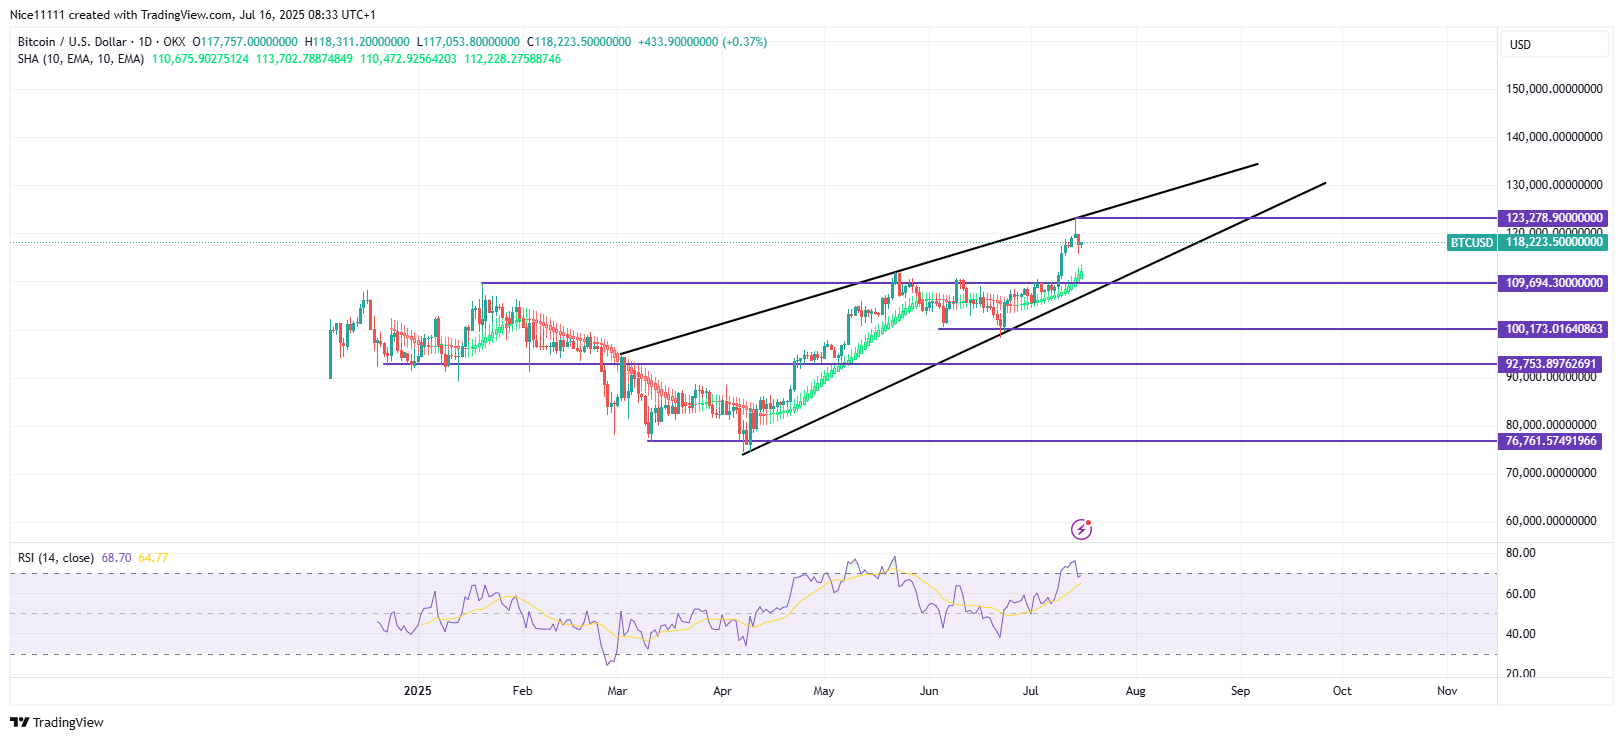
Bitcoin faced strong resistance at the $109,694 level, where its upward momentum stalled in January. Buyers attempted to break through this barrier in May and June but were initially unsuccessful. However, after multiple retests, the price eventually broke out, establishing a new all-time high at $123,278. This breakout marked the end of a reaccumulation phase and transitioned into a distribution phase.

The bullish rally has since formed a rising wedge pattern on the daily chart—a structure that often precedes either a continuation or a reversal. Recently, Bitcoin tested the upper boundary of this wedge, encountering resistance that led to a swing high. Despite this pullback, the overall structure remains intact, with no significant structural shift suggesting a trend reversal.
Bitcoin Key Levels
Resistance Levels: $130000, $140000, $150000
Support Levels: $100173,$92753, $76761
 What are the Indicators Saying?
Technical indicators provide additional confirmation of Bitcoin’s current market state. The Relative Strength Index (RSI) recently signalled overbought conditions, contributing to the recent pullback. However, the Smoothed Heikin Ashi candles continue to display a green hue, reinforcing underlying bullish strength.
The combination of these indicators suggests that while short-term profit-taking may cause minor retracements, the overall trend remains upward. Traders should watch for the RSI to cool off from overbought levels and for Heikin Ashi to maintain its bullish bias, as these signs indicate that the uptrend could resume.
Given the sustained bullish momentum, Bitcoin is expected to target higher psychological resistance levels at $130,000 to $150,000. The current pullback appears temporary, and as long as key support levels hold, the broader uptrend remains valid.
Learn from market wizards: Books to take your trading to the next level