ADVFN ADVFN

We could not find any results for:
Make sure your spelling is correct or try broadening your search.

Trending Now

Toplists

It looks like you aren't logged in.
Click the button below to log in and view your recent history.

Hot Features

Registration Strip Icon for pro Trade like a pro: Leverage real-time discussions and market-moving ideas to outperform.

Ethereum Soars Towards $4009.0

Share On Facebook
share on Linkedin
Print

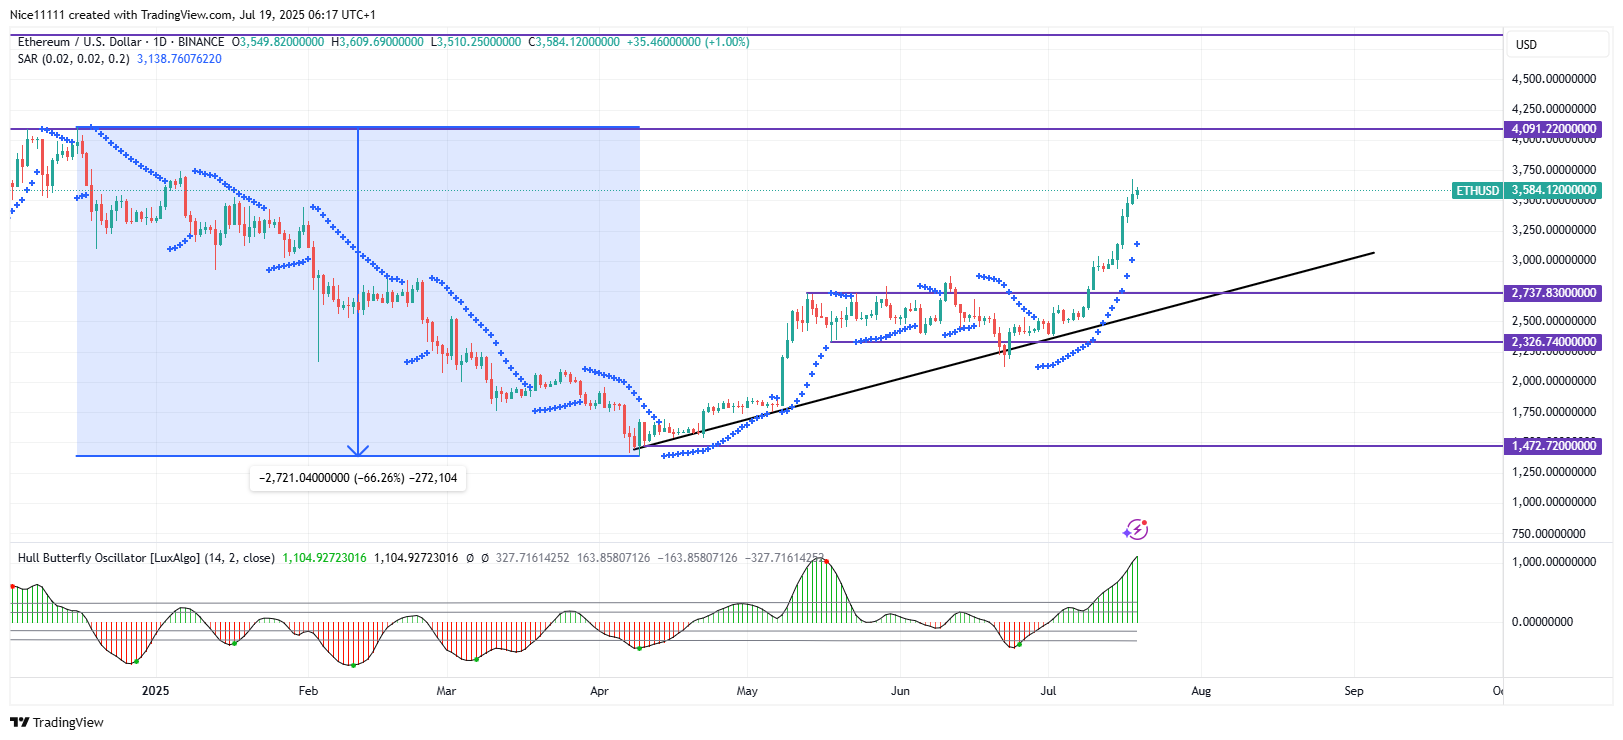
Ethereum began the year with a clear bearish shift in market structure. In December, a double top pattern formed at the $4009.0 level, which triggered a strong downside move. This led to a double Break of Structure (BOS) in January, confirming the bearish momentum. The subsequent downtrend resulted in a dramatic 66% decline in ETH’s value, ultimately bottoming out in April.

The new trend has unfolded in well-defined phases. It began with an impulsive bullish reversal that marked the end of the prior downtrend. This was followed by a corrective phase, during which the price ranged between $2737.0 and $2326.0. Recently, Ethereum has re-entered its impulsive phase and is now surging once again—rapidly approaching the key resistance level at $4009.0.

BINANCE:ETHUSD Chart Image by Nice11111Ethereum Key Levels

Demand Levels: $2326.0, $1472.0, $890
Supply Levels: $4091.0, $4869.0, $5000

What Are the Indicators Saying?

The Hull Butterfly Oscillator indicates that bullish momentum remains exceptionally strong. The current rally continues with such force that it offers very few clear entry points—except when examined on lower timeframes, where short-term pullbacks might emerge.

Meanwhile, the Parabolic SAR (Stop and Reverse) on the daily chart reflects a smooth and consistent upward trajectory, confirming that the trend is firmly in favor of the bulls. Ethereum appears poised to maintain its upward momentum as it targets new highs beyond the $4009.0 resistance level.

Learn from market wizards: Books to take your trading to the next level


CLICK HERE TO REGISTER FOR FREE ON ADVFN, the world's leading stocks and shares information website, provides the private investor with all the latest high-tech trading tools and includes live price data streaming, stock quotes and the option to access 'Level 2' data on all of the world's key exchanges (LSE, NYSE, NASDAQ, Euronext etc).

This area of the ADVFN.com site is for independent financial commentary. These blogs are provided by independent authors via a common carrier platform and do not represent the opinions of ADVFN Ltd. ADVFN Ltd does not monitor, approve, endorse or exert editorial control over these articles and does not therefore accept responsibility for or make any warranties in connection with or recommend that you or any third party rely on such information. The information available at ADVFN.com is for your general information and use and is not intended to address your particular requirements. In particular, the information does not constitute any form of advice or recommendation by ADVFN.COM and is not intended to be relied upon by users in making (or refraining from making) any investment decisions. Authors may or may not have positions in stocks that they are discussing but it should be considered very likely that their opinions are aligned with their trading and that they hold positions in companies, forex, commodities and other instruments they discuss.

Comments are closed

 
Do you want to write for our Newspaper? Get in touch: newspaper@advfn.com