Hot Features

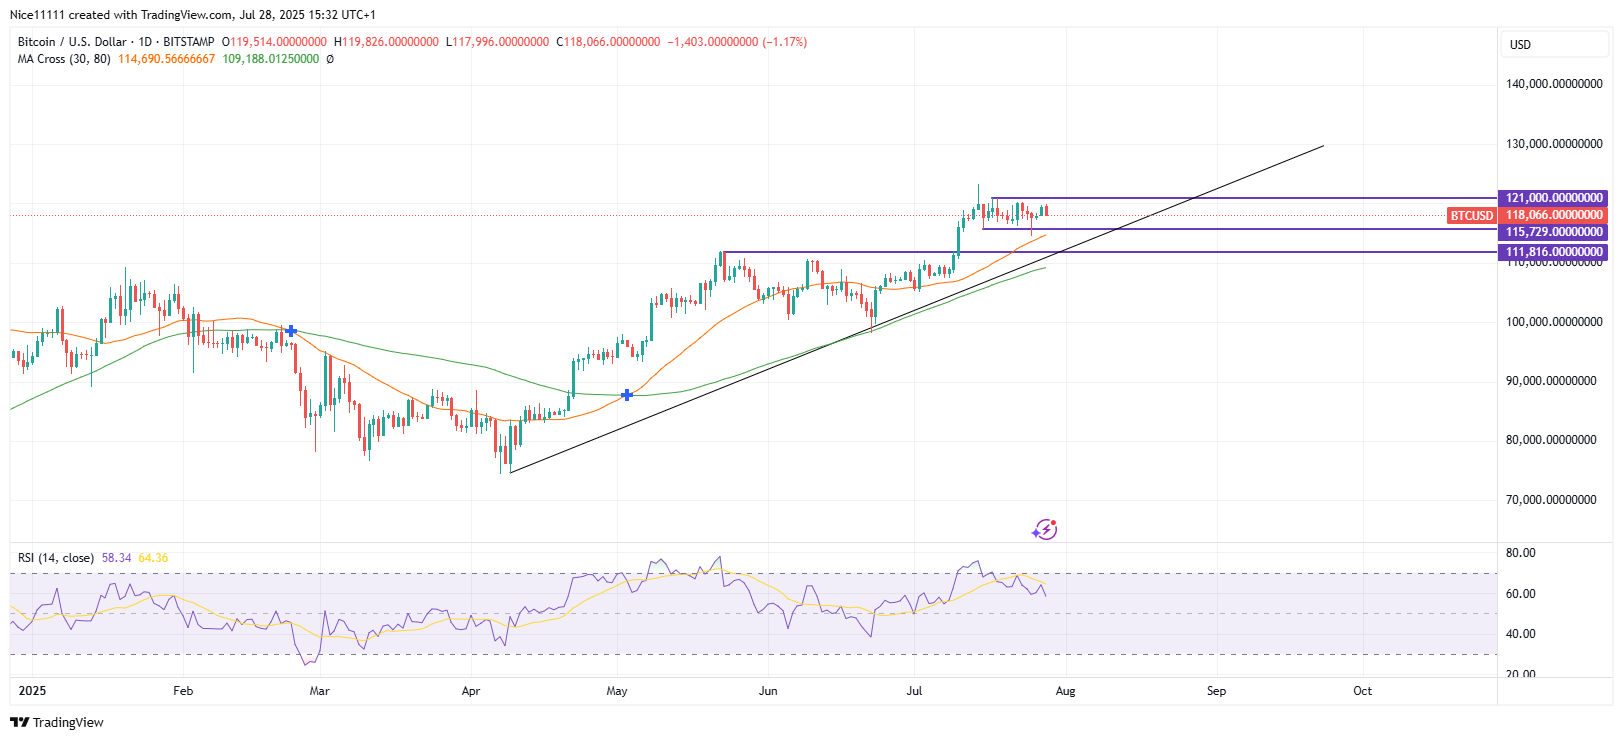
Bitcoin has transformed into a correction phase following an impulsive swing that created the current all-time high at $123,240.0. The correction appears to be a reaccumulation phase rather than a reversal, suggesting that the market remains overall bullish. A swing low at the beginning of the trend and a major swing low within the trend have been connected and extended with a bullish trendline to predict future price behaviour. This ascending trendline acts as a key dynamic support. Currently, the price is consolidating between the range of $121,000.0 and $115,729.0. Despite the short-term retracement, the price is still expected to test the bullish trendline for support before any significant upward continuation.

Bitcoin Key Levels
Demand Levels: $111,816.0, $100,000.0, $86,000.0
Supply Levels: $130,000.0, $140,000.0, $150,000.0
 What are the indicators saying?
Currently, the Relative Strength Index (RSI) reveals that the price is in the overbought region, aligning with the ongoing correction phase. This suggests a possible slip in price as the market searches for a solid support zone before resuming its bullish trajectory. Meanwhile, the 9-period and 21-period Moving Averages remain below the current price, reinforcing the broader bullish sentiment. This technical configuration implies that although Bitcoin may temporarily dip toward lower support levels, the prevailing market structure still favors a bullish continuation in the mid-to-long term.
Learn from market wizards: Books to take your trading to the next level