Brent has rallied over 14% since Wednesday’s OPEC production cut announcement and traders are unsurprisingly asking whether this burst higher has further to go…
With prices now probing a key resistance zone, price action during the next two sessions will offer a great indication as to whether Brent’s 2016 uptrend has legs.
The below chart shows Brent’s 3 year weekly candle chart.
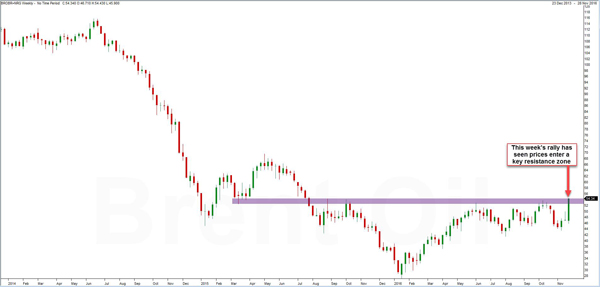
The chart highlights that a resistance zone between $52.5 to $54.3 has been in place for sometime. Over the last 15 months prices have hit and failed to break above this zone on four different occasions.
With prices bursting higher into this zone today a battle between the bulls and bears will likely ensue. Clearly, short momentum lies firmly in favour of the bulls and many believe OPEC’s production cut will usher in a higher oil price going forward. Let’s not forget it is the first OPEC production cut since 2008.
Should prices break and hold above 54.3 then this would represent a change in market structure and lay the foundation for a long-term uptrend to take shape.
At the minute, prices are at a point of inflexion. Moreover, with Brent implied volatility remaining elevated we are holding out on trading oil plays until we have clarity on whether the 52.5 – 54.3 resistance level holds.
Faraday Research offers real time FX and Equity trade signals from qualified analysts. Click here to try us free.
CLICK HERE TO REGISTER FOR FREE ON ADVFN, the world's leading stocks and shares information website, provides the private investor with all the latest high-tech trading tools and includes live price data streaming, stock quotes and the option to access 'Level 2' data on all of the world's key exchanges (LSE, NYSE, NASDAQ, Euronext etc).
This area of the ADVFN.com site is for independent financial commentary. These blogs are provided by independent authors via a common carrier platform and do not represent the opinions of ADVFN Ltd. ADVFN Ltd does not monitor, approve, endorse or exert editorial control over these articles and does not therefore accept responsibility for or make any warranties in connection with or recommend that you or any third party rely on such information. The information available at ADVFN.com is for your general information and use and is not intended to address your particular requirements. In particular, the information does not constitute any form of advice or recommendation by ADVFN.COM and is not intended to be relied upon by users in making (or refraining from making) any investment decisions. Authors may or may not have positions in stocks that they are discussing but it should be considered very likely that their opinions are aligned with their trading and that they hold positions in companies, forex, commodities and other instruments they discuss.

 Hot Features