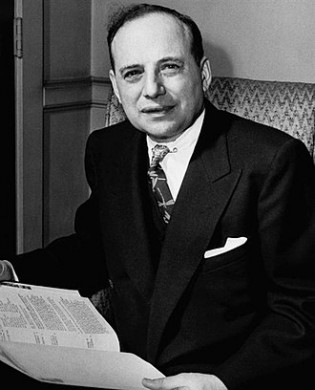
Last week, on my way to Omaha to meet fellow shareholders of Berkshire Hathaway, I set myself the task of reading through the Intelligent Investor, a book written by Warren Buffett’s mentor, Benjamin Graham. This is the book that transformed Buffett’s thinking on investing when he read it as a 19 year-old. He subsequently studied under Graham at Columbia and worked for him for a couple of years

.
.
.
.
.
.
.
.
.
.
.
.
.
Graham made a fortune using the net current asset value, NCAV, method. As readers of my newsletters will know, I’ve been using the NCAV method for a decade, explaining my rationale for investing in each company at the time of the investment – you can still read those rationales from each of the past ten years.
Net current asset value, NCAV, criteria
- Current asset values are taken from the balance sheet (e.g. inventory, receivables and cash). From this total are deducted all the liabilities. Long term asset values are usually ignored (counted as zero). Usually, further deductions are made to reduce inventory and receivable values to give a conservative bias.
- Companies passing the quantitative test are also assessed qualitatively for business prospects, managerial ability/integrity and business stability.
The Evidence
I had read the Intelligent Investor before, particularly at the time of writing my books, The Great Investors and The Financial Times Guide to Value Investing, but I had forgotten about a small table Graham presented. It made me sit up straight in my airline seat last Thursday. It showed that all the way back to the first half of the twentieth century had Graham set out evidence that NCAV worked – I don’t know how I had forgotten that table!
Here is the table (Graham shows just the results from 1957, but I know he employed this method each year in most of the 1930, 1940s to 1956 when he retired. He produced returns double those of the market from the mid 1930s to the mid 1950s):
Profit Experience of Undervalued Stocks
| Location of market | Number of Companies | Aggregate Net Current Assets Per Share, $ | Aggregate Price Dec 1957, $ | Aggregate Price Dec 1959, $ | ||||
| New York SE | 35 | 748 | 419 | 838 | ||||
| American SE | 25 | 495 | 289 | 492 | ||||
| Midwest SE | 5 | 163 | 87 | 141 | ||||
| Over the Counter | 20 | 425 | 288 | 433 | ||||
| Total | 85 | 1,831 | 1,083 | 1,904 |
Graham defined a NCAV bargain as one where the share is selling at less than “the company’s net working capital alone, after deducting all prior obligations.” (In my work – see results below – I often allow the long term asset of freehold or long-leasehold property to contribute to the NCAV).
The table shows the large margin of safety between the NCAV aggregate $1,831 and the market price to buy those net current assets, $1,083.
Graham commented on his work:
“Very few companies turn out to have an ultimate value less than the working capital alone, although scattered instances may be found. The surprising thing, rather, is that there have been so many enterprises obtainable which have been valued in the market on this bargain basis…[The table summarises] the result of buying, on Dec 31 1957, one share in each of the 85 companies in the list for which the data appeared in Standard & Poor’s Monthly Stock Digest, and holding them for two years.”
And on the results:
“each of the groups advanced in the two years to somewhere in the neighbourhood of the aggregate net-current-asset value. The gain for the entire “portfolio” in that period was 75%, against 50% for Standard and Poor’s 425 industrials. What is more remarkable is that none of the issues showed significant losses, seven held about even, and 78 showed appreciable gains.”
And, more generally:
“Our experience with this type of investment selection – on a diversified basis – was uniformly good for many years prior to 1957. It can probably be affirmed without hesitation that it constitutes a safe and profitable method of determining and taking advantage of undervalued situations.”
I’ve run out of space today to show you evidence of the application of the NCAV to UK shares that one of my PhD students and I wrote up for the Journal of Investing. I’ll put that in tomorrow’s newsletter along with the results of all my NCAV buys over the last decade.
Professor Glen Arnold now offers a Managed Portfolio Service at Henry Spain Investment Services under which clients’ portfolios contain the same shares as his (write to Jackie.Tran@henryspain.co.uk)
Risk Warnings: Past performance is no guarantee of future results. Certain investments carry a higher degree of risk than others and are, therefore, unsuitable for some investors. The value of investments, and the income from them, can go down as well as up, and you may not recover the amount of your initial investment. Where an investment involves exposure to a foreign currency, changes in rates of exchange may cause the value of the investment, and the income from it, to go up or down. Opinions constitute our judgement as of this date and are subject to change without warning. Neither Henry Spain nor any connected company accepts responsibility for any direct or indirect or on sequential loss suffered by you or any other person as a result of your acting, or deciding not to act, in reliance upon any information contained in this Leaflet. Before contemplating any transaction, you should consider whether you require any advice from a financial adviser which we would be happy to provide. The Managed Portfolio Service will be a fully advised process and advise charges will apply. This is a financial promotion. Henry Spain is authorised and regulated by the Financial Conduct Authority. Registered in England and Wales No. 7118506. Registered Office: 49a High Street, Market Harborough, Leicestershire, LE16 7AF

 Hot Features


