ADVFN Logo

We could not find any results for:
Make sure your spelling is correct or try broadening your search.

Trending Now

Toplists

It looks like you aren't logged in.
Click the button below to log in and view your recent history.

Hot Features

Registration Strip Icon for default Register for Free to get streaming real-time quotes, interactive charts, live options flow, and more.

USD/CHF: Potential For A Minor Rebound Before Its Next Leg lower

Share On Facebook
share on Linkedin
Print

Whilst the bias for USD/CHF remains for a break to new lows on the daily chart, we see potential for a minor rebound for intraday traders as its correction completes.

We noted recently that DXY could face headwinds as we head into April and, so far dollar bears are doing their bit to keep the greenback under pressure. Looking through last week’s COT report revealed net-long exposure for DXY fell to an 8-month low ahead of the Fed meeting, and their dovish meeting may well add further pressure to USD if Fed revert to an easing mode. With that said, we continuing to monitor USD/CHF to see if it can break lower.

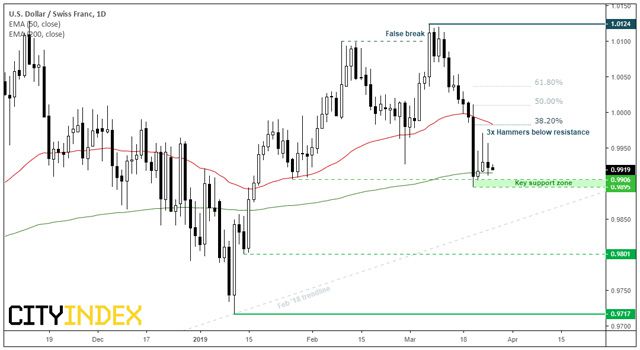
When we last covered USD/CHF, we noted that caution was warranted around current levels (≈0.9900) as the move lower was at risk of over-extension: it had stalled at the 200eMA, tested the lower Keltner band and was near a structural swing low. Three session later, three bearish hammers have formed to show bears are struggling to lift it convincingly from its lows where a direct break of 0.9895 assumes a run towards 0.9800, with the Feb 20118 trendline acting as interim support.

However, dropping to the four-hour chart show potential for a minor rebound for intraday traders. A spinning top doji shows potential to mark a higher low, and the overlapping nature of candle ranges suggests price action is corrective. Furthermore, a minor rebound from current levels would appear consistent with a 3-wave move / ABC correction.

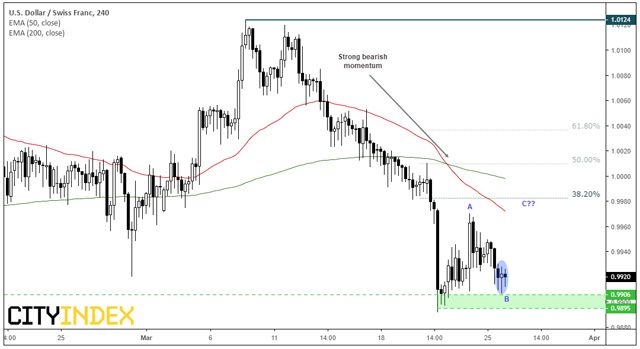
From here we’d continue to monitor for signs of weakness below the 38.2% Fibonacci retracement level and 50-day eMA. And, as momentum on the daily- chart remains predominantly bearish, we suspect upside potential could be limited and for an eventual break beneath 0.9895.


City Index: Spread Betting, CFD and Forex Trading on 12,000+ global markets including Indices, Shares, Forex and Bitcoin. Click here to find out more.

CLICK HERE TO REGISTER FOR FREE ON ADVFN, the world's leading stocks and shares information website, provides the private investor with all the latest high-tech trading tools and includes live price data streaming, stock quotes and the option to access 'Level 2' data on all of the world's key exchanges (LSE, NYSE, NASDAQ, Euronext etc).

This area of the ADVFN.com site is for independent financial commentary. These blogs are provided by independent authors via a common carrier platform and do not represent the opinions of ADVFN Plc. ADVFN Plc does not monitor, approve, endorse or exert editorial control over these articles and does not therefore accept responsibility for or make any warranties in connection with or recommend that you or any third party rely on such information. The information available at ADVFN.com is for your general information and use and is not intended to address your particular requirements. In particular, the information does not constitute any form of advice or recommendation by ADVFN.COM and is not intended to be relied upon by users in making (or refraining from making) any investment decisions. Authors may or may not have positions in stocks that they are discussing but it should be considered very likely that their opinions are aligned with their trading and that they hold positions in companies, forex, commodities and other instruments they discuss.

Leave A Reply

 
Do you want to write for our Newspaper? Get in touch: newspaper@advfn.com